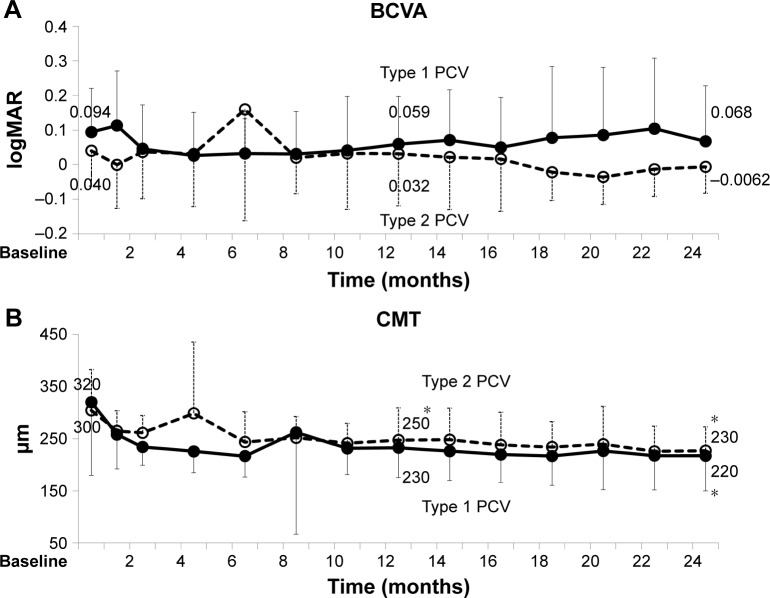
Figure 6.
BCVA and CMT over 2 years of treatment in type 1 PCV and type 2 PCV (mean, SD).
Notes: *P<0.05. (A) Solid line: 12 eyes with type 1 PCV. Mean BCVA (0.059) at 12 months and (0.068) at 24 months are not significantly improved from initial mean BCVA (0.094) (paired t-test, P=0.4 and 0.07, respectively). Broken line: nine eyes with type 2 PCV. Mean BCVA (0.032) at 12 months and (−0.0062) at 24 months are not significantly improved from mean initial BCVA (0.040) (paired t-test, P=0.2 and 0.3, respectively). (B) Solid line: mean CMT of type 1 PCV tended to be improved at 12 months (230 µm) and 24 months (220 µm) than at baseline (320 µm) (paired t-test, P=0.09 and 0.03, respectively). Broken line: mean CMT of type 2 PCV improved at 12 months (250 µm) and 24 months (230 µm) than at baseline (300 µm) (paired t-test, P=0.04 and 0.02, respectively).
Abbreviations: BCVA, best-corrected visual acuity; CMT, central macular thickness; logMAR, logarithm of minimum angle of resolution; PCV, polypoidal choroidal vasculopathy.

