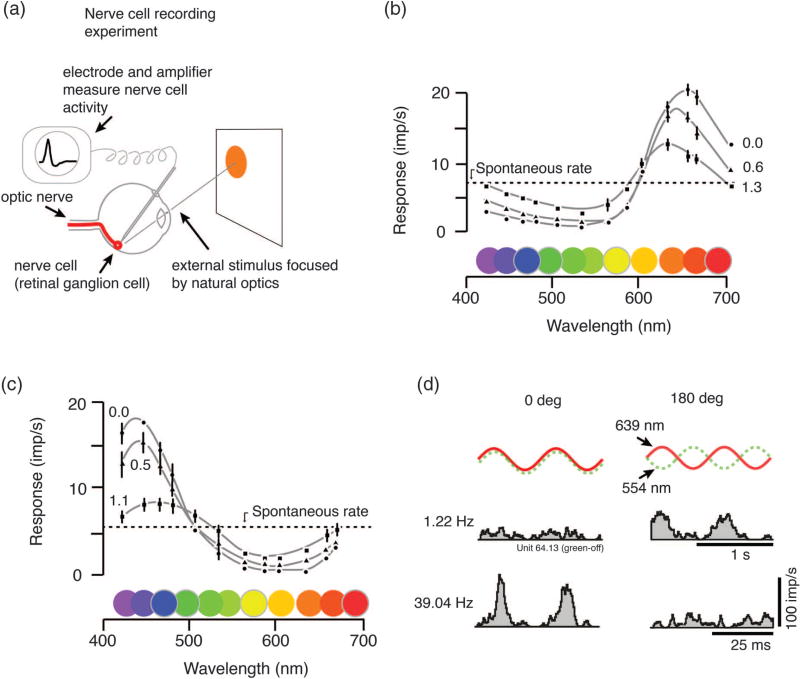
Fig. 3.
Physiological measurement of opponency. (a) Opponency defined by nerve cell recording. The visual system of an anaesthetized monkey responds to brief pulses of light presented on a stimulus screen. The small electrical signals (action potentials) from these cells are picked up by an electrode and amplified. (b) These famous recordings by De Valois and colleagues show responses of single nerve cells in monkey visual system to lights at different wavelengths. Here the opponent process is revealed as the cell is excited by some wavelengths (in this case, long wavelengths) and inhibited by others (that is, the spike rate falls below the maintained rate). Measurements were taken at three steps of brightness attenuation, showing that the opponent characteristic does not depend heavily on brightness. (c) Other cells show blue–yellow opponent property. (d) Opponency can also be measured by responses to a mixture of wavelengths projected into the eye. The frequency of action potentials is measured as a function of time relative to the stimulus modulation. If the response to in-phase modulation (0 deg phase difference, left column) is less than the response to out-of-phase modulation (180 deg phase difference, right column), we know that something in the retina has “subtracted” the neural response to 554 nm (“green”) light from the response to 639 nm (“red”) light (upper histograms). The process can be studied in detail by changing the frequency and phase of light modulation (lower histograms). Panels (b) and (c) modified from [12]. Panel (d) modified from Solomon et al. (2005) [13].

