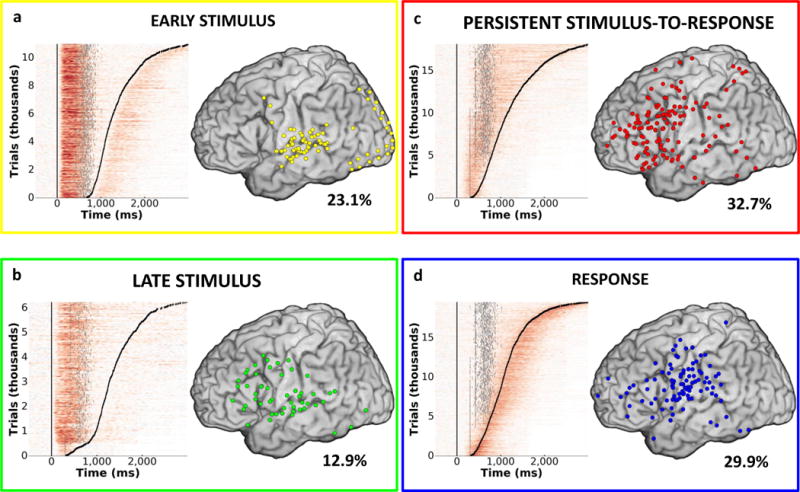
FIG 3. Cortical distribution and temporal dynamics of HG activity.

Four common patterns of HG activity were observed: Early Stimulus (Panel a), Late Stimulus (Panel b), Persistent Stimulus-to-Response (Panel c), and Response (Panel d). Single trial plots for all participants, tasks, and channels sorted by response times (black tick marks) are presented on the left side of each pane. Stimulus offset is plotted for each trial as a gray tick mark. Cortical distribution (left lateral surface) of sites corresponding to each HG pattern is presented on the right. Percent of all active sites exhibiting the corresponding HG pattern is indicated for each activity type.
