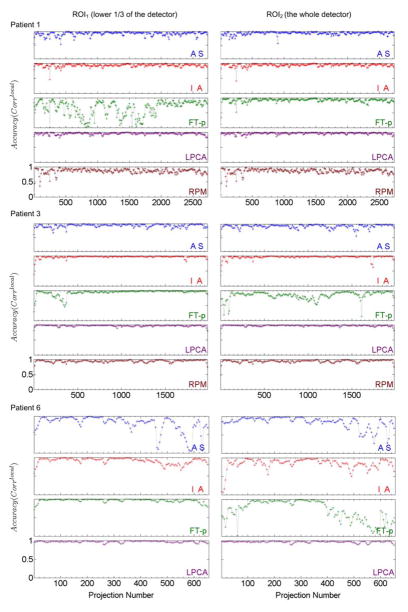
Figure 6.
Local correlation coefficients (Corrlocal) between the breathing signals extracted by various methods (AS, IA, FT-p, LPCA, and RPM) and the benchmark signals for patients 1, 3 and 6 (with diaphragm in the projection images) for two different ROI’s (ROI1 - left column and ROI2 – right column). For every sub-plot the y axis ranges from 0 to 1.

