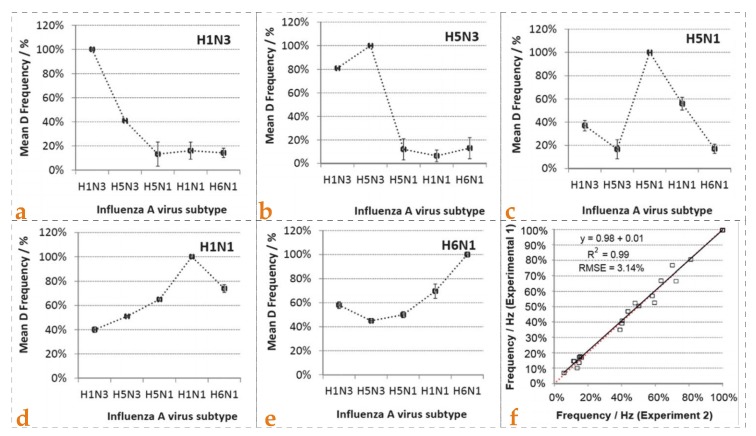
Figure 6.
The relative sensor effects of five different sensors designed for monitoring influenza A virus sub-types are shown from (a–e). It is evident that each MIP layer showed the highest sensor response to the virus that was used as template during imprinting; (f) shows the reproducibility studies as a sensor signal of two MIP layers imprinted with the same virus sub-type and compared, the R2 value was 0.99 and standard error was found 3.1% for 50 measurements, reproduced with permission from [88].

