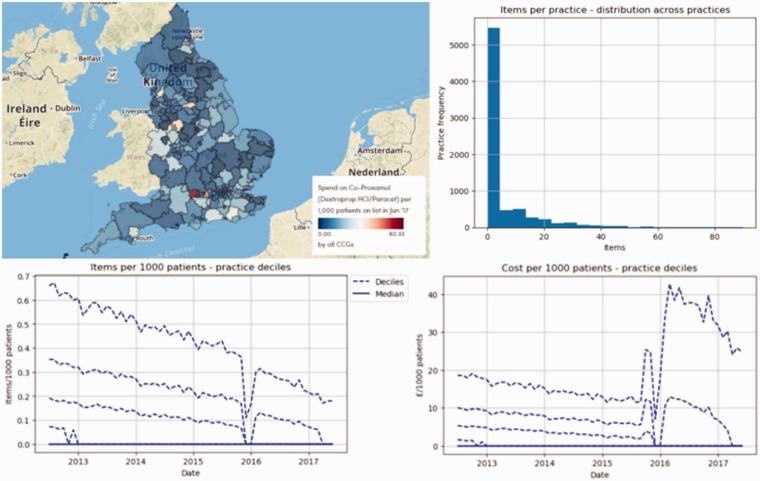
Figure 3.
Variation in prescribing of co-proxamol, from top left to bottom right: variation in cost geographically at Clinical Commissioning Group level (£ per 1000 patients, June 2017); variation in items across practices within the last year; practice level variation in items over time and practice level variation in cost over time.

