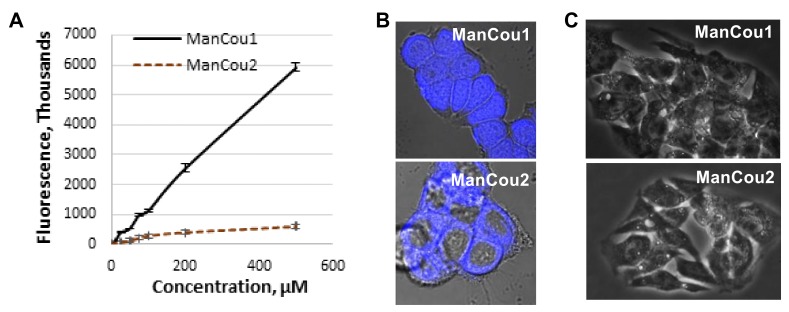
Figure 3.
ManCou uptake analysis. (A) Concentration-dependent uptake in MCF7 cells in 96-well plate; (B) brightfield and fluorescence (DAPI) overlay of confocal Z-stack images of MCF7 with ManCou1 and ManCou2; (C) brightfield and fluorescence (DAPI) overlay of confocal Z-stack images of HepG2 cells with ManCou1 and ManCou2. Images taken with 20 µM ManCous at 405 nm excitation and 461 nm emission (60× for MCF7 cells and 40× for HepG2 cells).

