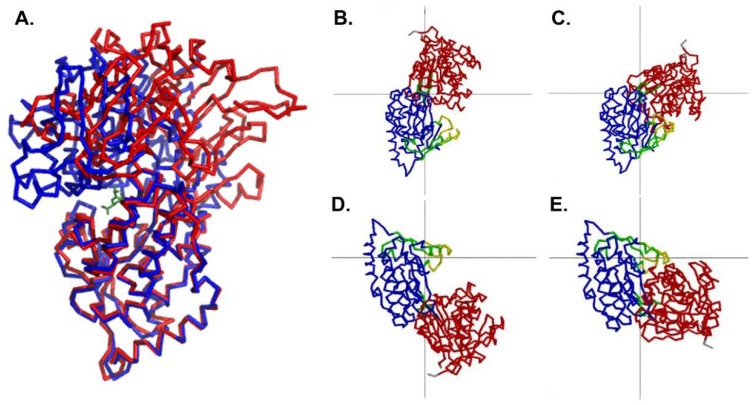
Figure 2.
Comparison of the open conformation and the closed conformation. (A) Domain 2 of the open conformation of MppA (PDB ID 4TOZ, red bonds) was superposed on the equivalent alpha carbons of the closed conformation (PDB ID 3O9P, blue bonds). The murien tripeptide (green bonds) is shown bound to the closed conformation of MppA. (Superposition was calculated using Coot [39]. Figure made using PyMol [43]). (B–E) show the results of an analysis of domain motions by DynDom [48]. (B,C) focus on the larger conformational change with domain 2 (blue) fixed in position and domain 1 (red) moving relative to it. The green residues near the center of the figure are the bending residues, and the grey lines cross at the center of the rotation. (D,E) focus on the smaller conformational change that takes place within domain 2, with the larger subdomain (blue) fixed and the smaller subdomain (yellow) moving relative to it. The grey lines cross at the center of rotation, and the green residues near the center of rotation are the bending residues.

