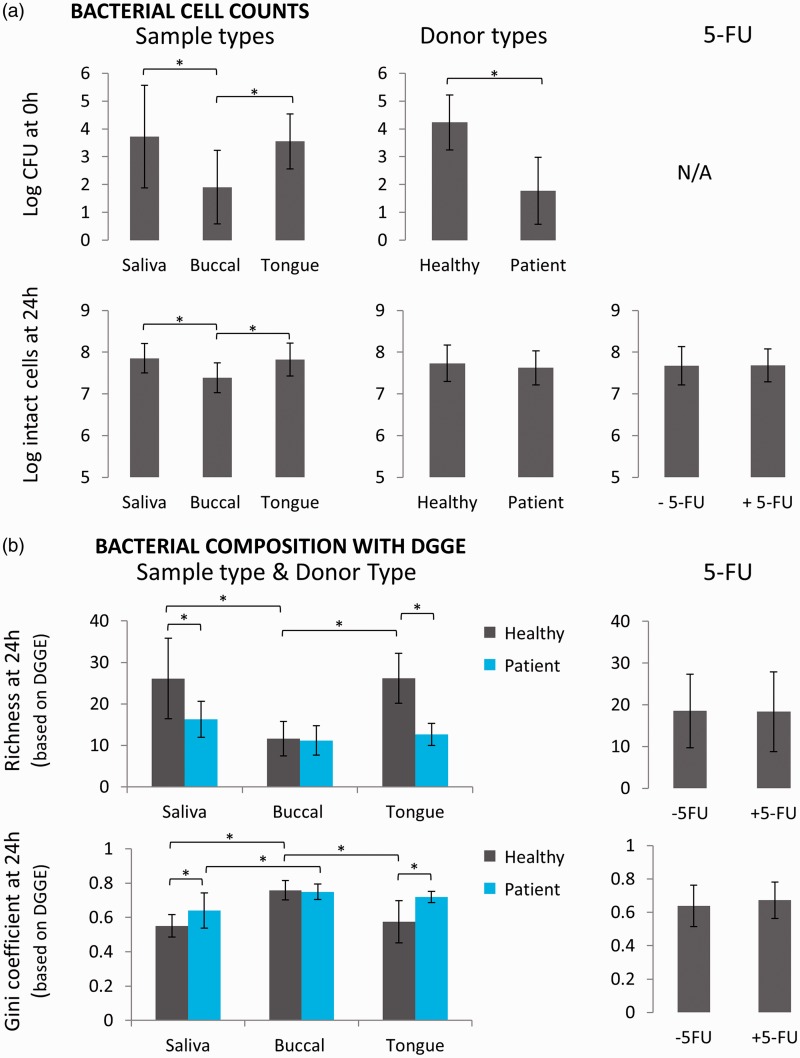
Figure 3.
Bacterial cell counts and composition of microbiota derived from different sample and donor types cultured in the oral co-culture model in presence or absence of 5-FU. Sample type data represent pooled data of all donor types in presence and absence of 5-FU and similar pooled data are used for graphs concerning donor type and 5-FU. (a) Bacterial cell counts at t = 0 h and t = 24 h (AV ± SD); (b) Richness and Gini coefficient as measure for bacterial diversity by DGGE (AV ± SD). Significant differences between groups are indicated by the asterisks (P < 0.05). (A color version of this figure is available in the online journal.)

