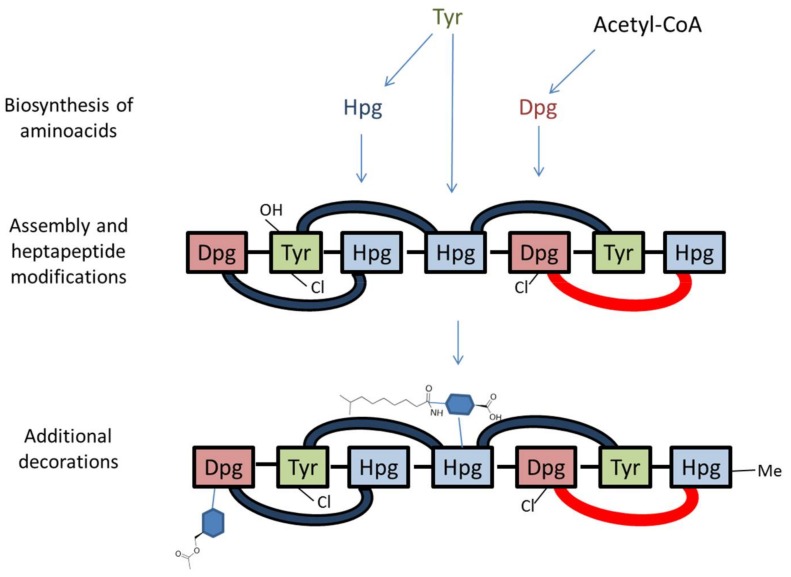
Figure 3.
Simplified model of O-acetyl A40926 biosynthesis. Note that the heptapeptide is drawn right (N-terminus) to left (C-terminus), consistent with Figure 1. Cross-links are indicated by blue (C–O–C) or red (C–C) arcs. Sugars are represented as blue hexagons. Refer to Figure 2 and Table 1 for details.

