Figure 1.
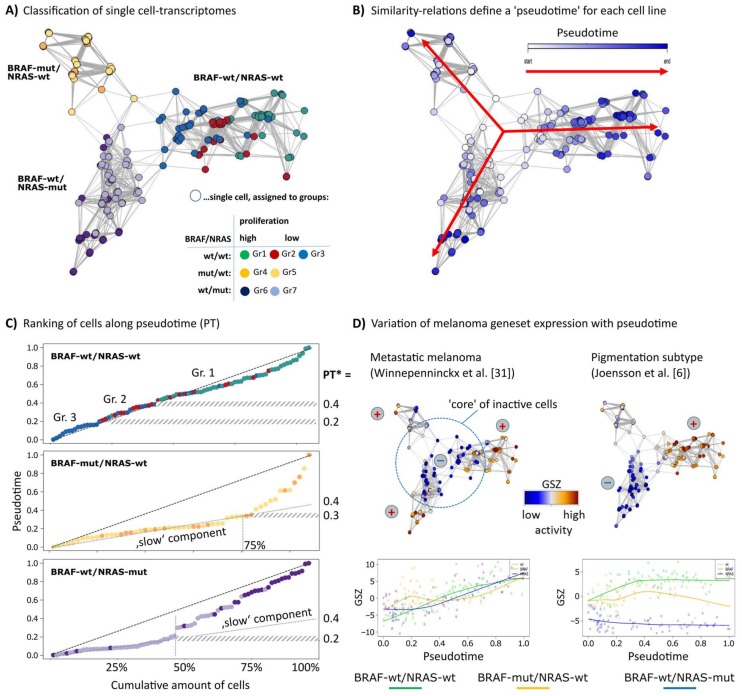
Diversity and pseudotime (PT) ranking of single-cell transcriptomes of melanoma cell short-term cultures. An analysis of single-cell transcriptomes of melanoma short-term cultures was performed using the Wanderlust algorithm. (A) The network presentation visualizes similarity relations between the single-cell transcriptomes of the three cell cultures studied. Each cell culture forms a separate branch where the cells were classified into seven groups as described previously [12]. (B) Cells were recolored according to their PT dynamics from early (white) to late (dark blue) in direction of the arrows where the highly proliferative cells were assigned to later PT. The PT was calculated separately for each cell line. (C) The plots of PT as a function of call rank indicate a virtually linear relation for wt/wt cells or an initial slow component for the two mutant cell lines. PT* defines characteristic PT-values: PT’s referring to alterations of the group-programs (BRAF-wt/NRAS-wt) and alteration from the the ‘slow’ into the ‘faster’ component (BRAF-wt/NRAS-mut and BRAF-mut/NRAS-wt). (D) Mean expression (GSZ-score) of signature gene sets of metastatic melanomas described by Winnepenninckx and co-workers [31] is consistently high at late PT values in all cell lines, which indicates that PT direction is consistent with melanoma progression towards high grade (bad prognosis) melanomas. Signature genes of the pigmentation subtype [6] show a bipolar pattern with high expression in wt/wt cells, low expression in BRAF-wt/NRAS-mut cells and intermediate and fluctuating levels in BRAF-mut/wt cells.

