Figure 5.
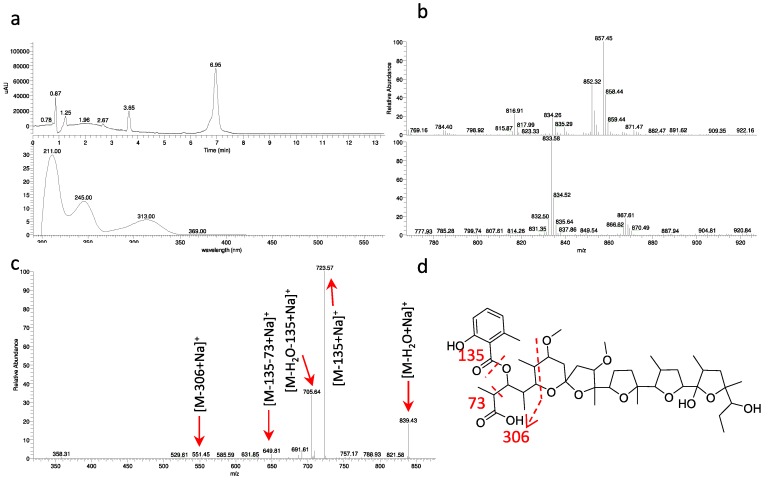
Analysis of α-770. (a) UV chromatogram at 230 nm and UV spectrum of 6.9-min peak. Data obtained with a partially purified extract of Actinoallomurus sp. ID145770; (b) MS at 6.9 min in positive (above) and negative (below) ionization mode; (c) MS2 of m/z [M+NH4]+ 852; (d) putative fragmentation pathway for α-770.

