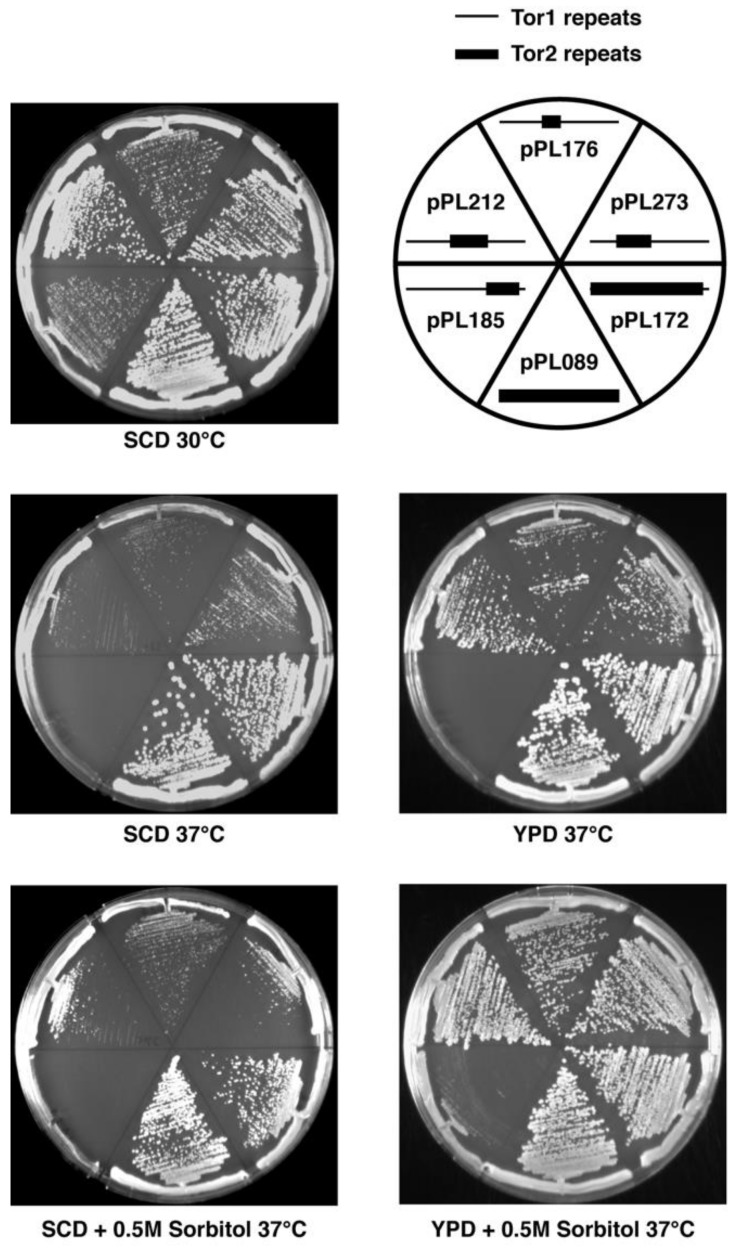
Figure 2.
Phenotypes of selected chimeras in tor2Δ cells on solid medium. Plates contained the indicated media and were grown for 2 days at the indicated temperatures and then photographed. Legend depicts chimeras tested on the corresponding plates. Schematic indicates N-terminal Tor2 (heavy lines) versus Tor1 (thin lines) regions in each chimera.

