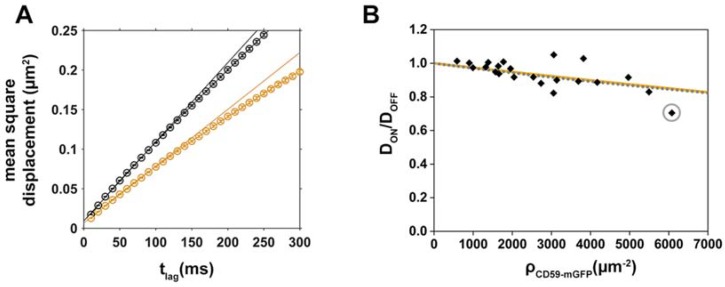
Figure 2.
Mobility of the cholesterol analog Chol-PEG-KK114 decreases with increasing CD59-mGFP surface density. (A) Mean square displacements (msd) of “ON” (orange) and “OFF” (black) CD59-mGFPI areas are plotted as a function of tlag for one representative cell. Diffusion coefficients were determined by fitting the function msd = 4Dtlag + 4σxy2; (B) Relative diffusion coefficients DON/DOFF were determined for individual cells (N = 22), plotted as a function of CD59-mGFP density, ρCD59-mGFP, and fitted with Equation (2) (steric obstacles, orange line) or Equation (1) assuming a combined size of tracer and obstacle d = 2 nm (binding, dotted grey line). The gray circle indicates the cell shown in (A).

