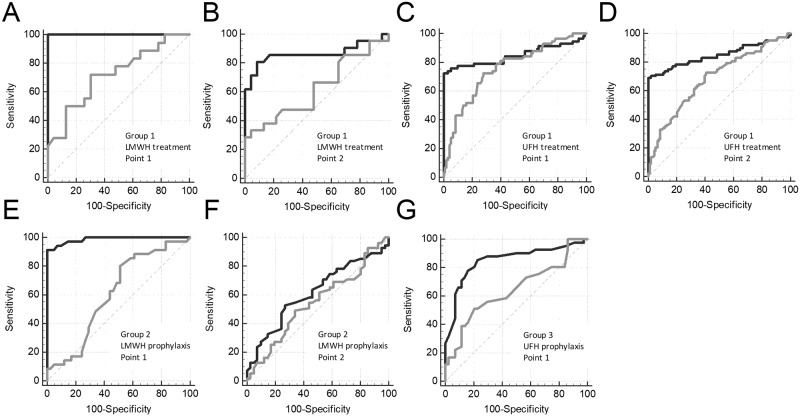
Fig 3. Heparin effect on APTT vs TD.
ROC curves for APTT (gray lines) and V in TD (black lines) for treatment with LMWH (group 1) at the Point 1 (A) and Point 2 (B) or UFH (group 1) at the Point 1 (C) and Point 2 (D) and prophylactics with LMWH (group 2) at the Point 1 (E) and Point 2 (F) or UFH (group 3) at Point 1 (G). Data of the same patients before the first heparin injection were used as controls.

