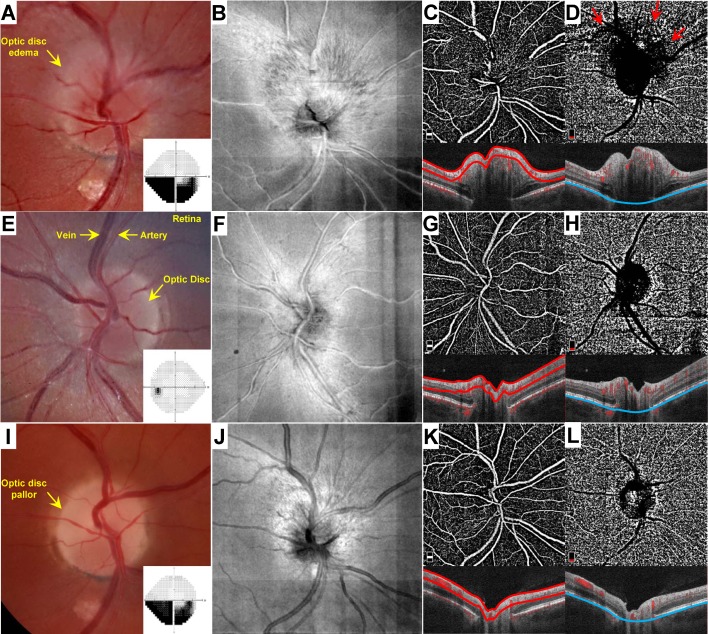
Fig 1. Representative OCT-A analysis in a patient with unilateral NAION.
The patient is a 42 year-old man who presented 4 days after experiencing painless visual loss in the right eye. Fundus photographs of the affected right (A) and unaffected left (E) eyes. Automated (Humphrey 24–2) perimetry grey scale results for the right (A) and left (E) eyes are provided as insets. En face images of the right (B) and left (F) eyes. OCT-A images with segmentation of the superficial papillary capillary network (C, G) and choriocapillaris (D,H). Corresponding B-scan images denote segmentation boundaries (red, superficial; blue, choriocapillaris). Red arrows in D denote blockage artifact imparted by overlying optic disc edema. (I-L) Evaluation of the same patient 7 weeks after the initial presentation. (I) Fundus photographs of the affected right eye. Inset depicts Automated (Humphrey 24–2) perimetry result for the right eye at that time. (J) En face image of the affected optic disc at that time. OCT-A image with segmentation of the superficial papillary capillary network (K) and choriocapillaris (L).

