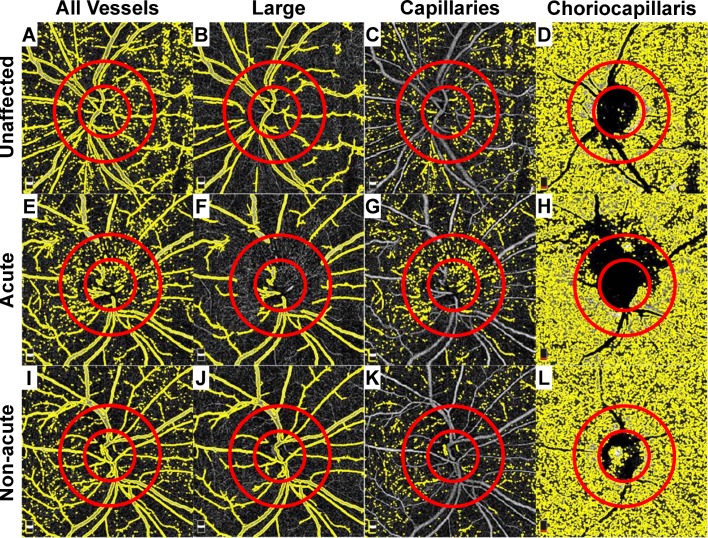
Fig 2. Quantitative analysis of OCT-A images.
The superficial and choriocapillaris segmentation images from Fig 1 are included. In all cases, a 1.73 mm diameter region of interest (ROI) was centered on the optic disc using the deep choroidal images as a reference for the disc margins (smaller red circle). Another 3.46 mm diameter ROI was drawn to sample the peripapillary capillary network (larger red circle). The total angiographic signal (A, E, I), filtered large vessels (B, F, J), superficial capillaries (C, G, K) and choriocapillaris segmentation are included for the unaffected (A-D), acutely affect (E-H), and non-acutely affected (I-L) eyes.

