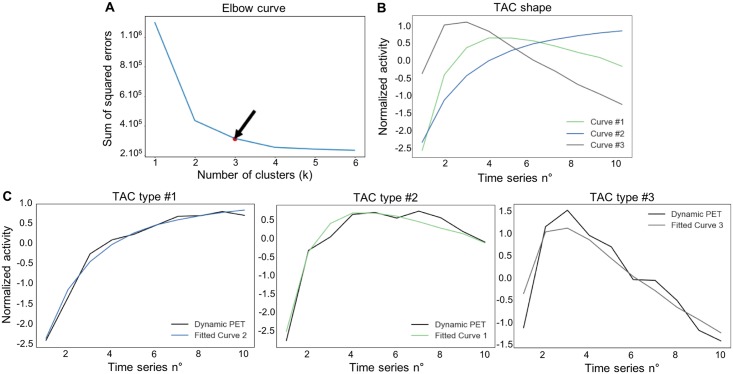
Fig 2. Voxel clustering and features extraction from dynamic 18F-FET PET.
A. The Elbow method, where the abscissa is the time series number and the ordinate axis the sum of squared errors between each voxel real value and the associated centroid which fitted best the time-activity curve (TAC). Black arrow represents the break point in the curve, corresponding to 3 clusters centroids. B. The 3 centroids included in the final model; centroid #1: slowly increasing slope; centroid #2: increasing slope and slowly decreasing slope; centroid #3: rapidly increasing followed by rapidly decreasing curve. C. Centroid #1, centroid #2 and centroid #3 fitted with 3 TAC (black curves) of voxels.

