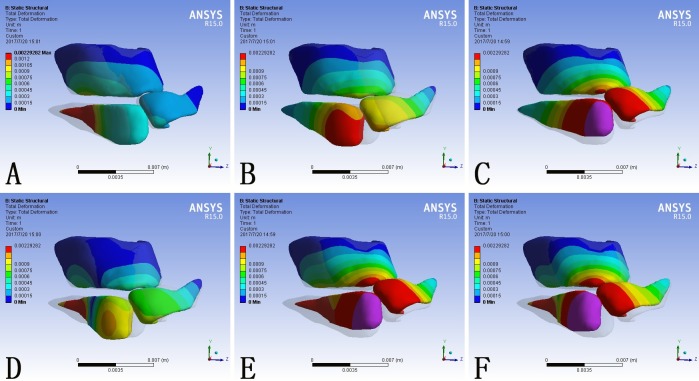
Fig 3. Total deformation of the nasal cartilage framework consequent to different force loadings.
(A) F1 alone; (B) F2 alone; (C) F3 alone; (D) F1 plus F2; (E) F1 plus F3; (F) F1, F2 and F3 at the same time. Blue represented the fixed part of the model. The grey shadow represented the pre-simulation position of the model.

