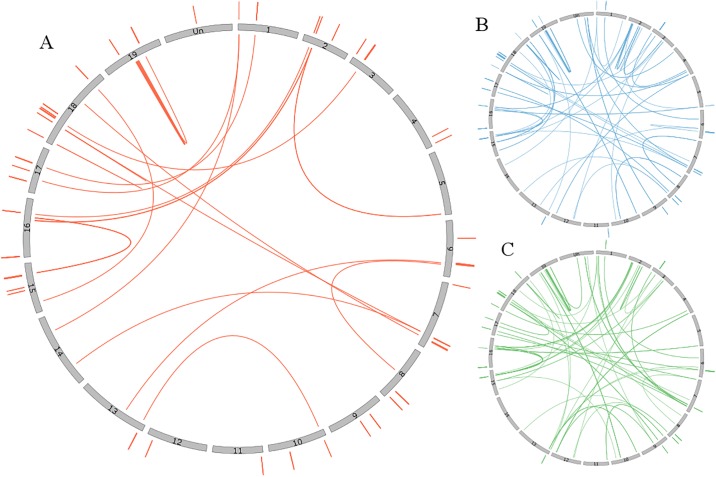
Fig 3. Similarity of the P450 genes between and within clusters.
For each circle, the grey bars correspond to the 19 grape chromosomes and the “Unknown chromosome”. The lines connect complete P450 genes according to their similarity. The lines outside the circles show the similarity between genes of the same cluster, whereas the lines in the circle connect similar genes of different clusters. Only P450 genes that form clusters composed of at least two complete genes are illustrated here. The seven largest clusters are labeled with numbers corresponding to Table 1. The lines are connecting the genes corresponding to the best BLAST hit (A), second best hit (B) or third best blast hit (C).

