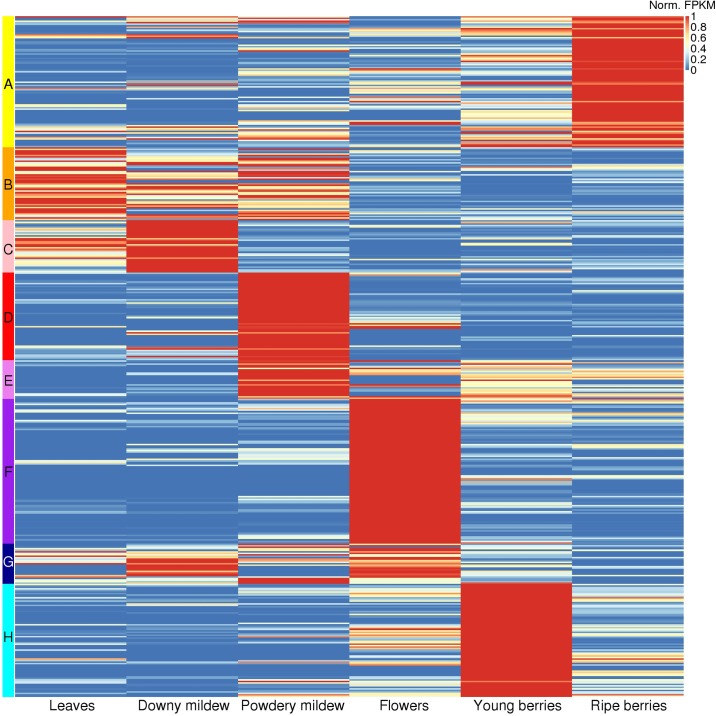
Fig 5. Heatmap of the P450 sequences, clustered according to their expression profile.
The expression levels were averaged over the experiments classified in one of the six experimental categories: leaves, downy mildew (Plasmopara viticola) infected leaves, powdery mildew (Erysiphe necator) infected leaves, flowers, young berries and ripe berries. This heatmap includes the 457 expressed cytochrome P450 sequences. The color scale for the expression level represents FPKM values normalized by row ((FPKM value − row minimum) / row maximum). The color bars on the left are showing the eight expression clusters, which are designated by the letters on the side.

