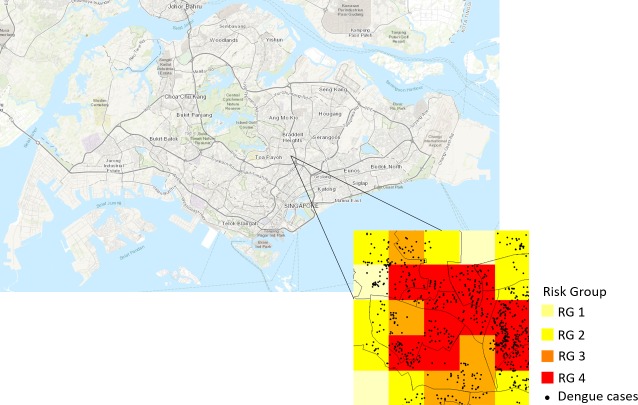
Fig 4. Risk grouping of a small area with 2016 dengue cases (black circles) overlaid.
The risk groups are color-coded, with RG 4 (highest risk) as red and RG 1 (lowest risk) in light yellow. The figure was created using R software with base layer obtained from https://landsatlook.usgs.gov/.

