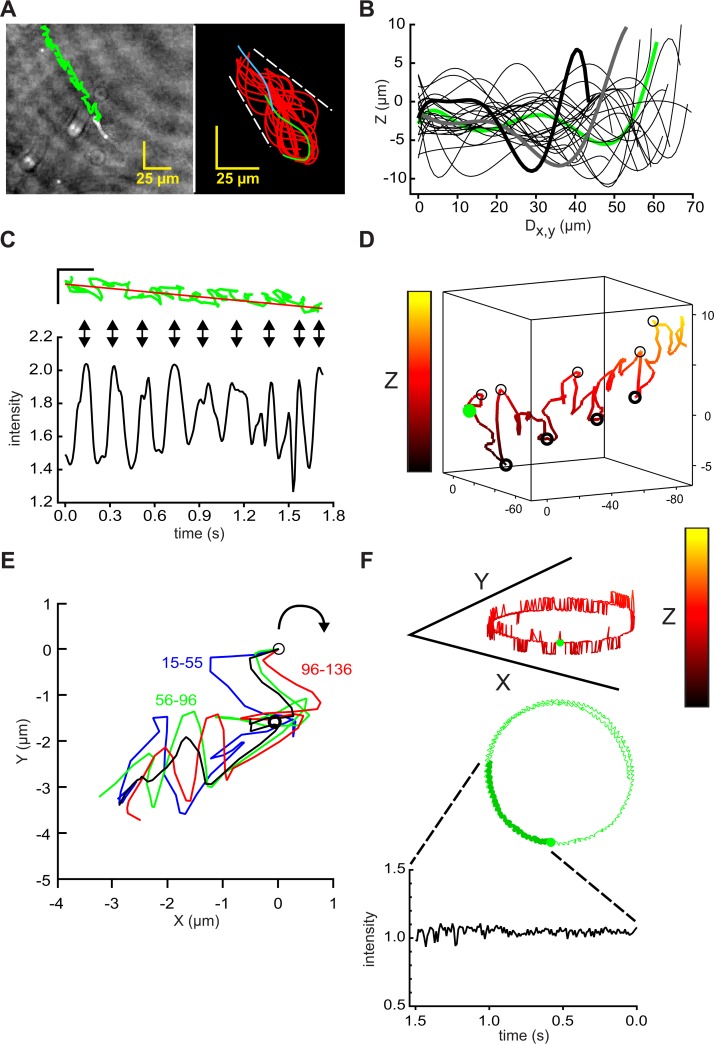
Fig 4. Holographic imaging provides 4D descriptions of flagellar waveform and swimming trajectories of bull sperm.
(A) (left) Path of the head of a free-swimming bull sperm (green) overlaid on the XY projection of the final frame of a 1.8s holographic record sampled at 100 Fps, scale bars 25 μm; (right) flagellar traces sampled at 50 Fps for the first 2 beat cycles (~0.5 s). First trace (green), final trace (blue). Waveform envelope ~25 μm. (B) Z-plane excursions, by interrogation of the holographic records with x,y coordinates from the traces in right panel of A. Z-plane data sampled from alternate frames, smoothed by fitting to 7th order polynomials, plotted against calculated distance along the XY projection of the flagellum (Dx,y). Data from frame 0 is green, from frames 2, 4, …46 are black, from frames 48 and 50 heavy gray and black. (C) Rotated version of the time course of swimming path in green with its regression line in red, scale bars 25 μm (upper panel). Vertical arrows show alignment with peaks in the intensity of light scattered from the head (relative to cell-free background, lower panel) intensity. (D) 3D view of swimming path of sperm head, green circle marks beginning, light and heavy circles mark locally-maximal positive and negative Z-plane excursions. X,Y, and Z scales 140, 140, and 14 μm. (E) Procrustes alignment of indicated path segments, black is averaged alignment. Light circle marks origin, heavy circle marks midpoint of the averaged alignment. (F) 3D view of the circular path of another cell projected onto the XY-plane (upper panel), green circle marks beginning. The middle panel shows XY-plane projection of the swimming path (X and Y scales 140 μm, Z scale 14 μm). Lower panel, time course of optical signal from the head during initial 1.5 s path segment (heavy green in middle panel).

