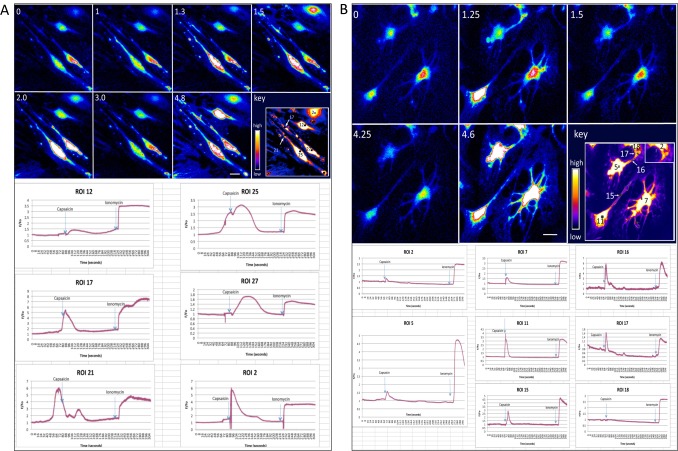
Fig 5. Response to capsaicin.
Panel A, Time course of Fluo-4 intensities before and after addition of Fluo-4. Upper panel, four cell bodies are visible (D21 of culture). Numbers in upper left of individual images correspond to time in minutes of experiment. (0; minute zero) Images captured before addition of capsaicin. (min.1) Before the addition of capsaicin, spontaneous activity was observed in the two cells at the lower left (region of interest 25 and 27). Capsaicin was added at min 1.25. At 1.3 min and 1.5 min, intensity of fluorescence increased in the two cells at the lower left and the cell at the upper right reached its peak of reacting to capsaicin. (min. 2.0) By minute 2.0, the two neurons at the lower left reached their peak of fluorescence, as did the cell above. (3.0) By 3 minutes, intensity of fluorescence had decreased in all cells. Ionomycin was added at minute 3.4.; image was captured at min. 4.8. All four cells responded to ionomycin with calcium flux. Lower panel, F/F0 plots of various ROIs, as identified in the image marked ‘key’. ROI 21 showed spontaneous activity prior to the addition of capsaicin, which was closely followed by activity in ROI 25 of the same cell, whereas ROI 21 responded again with a delay. All cells and ROIs responded to ionomycin. Panel B, Capsaicin sensitivity of D21 cells in a different experiment and culture. Capsaicin was added at minute 1.1. Seven of 8 ROIs showed a fast response to capsaicin. All showed a robust response to ionomycin. Cells had a flattened appearance due to the 24-hour exposure to FBS. Morphology did not affect capsaicin-responsiveness. Bars, Panels A and B, 25 μm.

