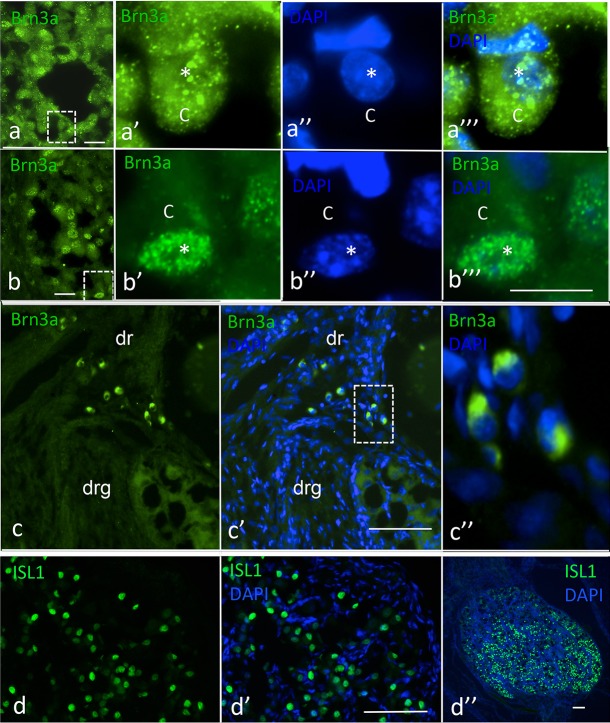
Fig 6. BRN3a and ISL1 immunofluorescence in thoracic human foetal DRGs at 12 PCW.
(a–a”‘) Cytoplasmic Brn3a immunofluorescence in 12 PCW DRG. (a) Overview of ganglionic area. (a’) Larger magnification of boxed area in (a); asterisk, location of nucleus; c, cytoplasm. (a”) DAPI nuclear stain of same area as in (a’). (a”‘) Merged images. (b–b”‘) Nuclear expression of Brn3a in 12 PCW DRG. (b) Overview of ganglionic area. (b’) Nuclear expression of Brn3a; asterisk, nucleus; c, cytoplasm. (b”) DAPI nuclear stain. (b”‘) Merged images. (c-c”) Cytoplasmic expression of Brn3a in boundary cap cells; (c) Brn3a expression; dr, dorsal root; drg, dorsal root ganglion. (c’) Brn3a and DAPI merged images. (c”) Larger magnification of boxed area in (c’). (d–d”) ISL1 expression in 12 PCW DRG. (d) Green ISL1 immunofluorescence. (d’) ISL1 and DAPI merged images of same area shown in (d). (d”) ISL1 (green) and DAPI (blue) merged images of entire section of the same ganglion. Bars; (a), (b), 50 μm; a’ a”‘ and b’–b”‘, 25 μm; (c–c’), 50 μm; (d–d’), 50 μm.

