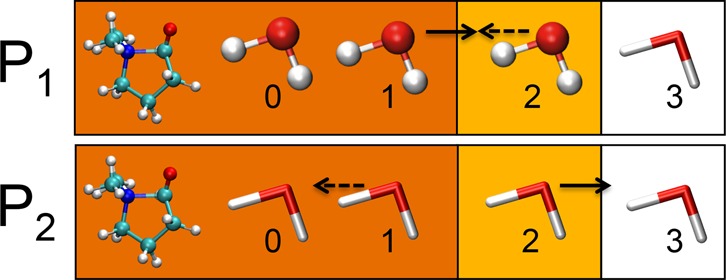
Figure 5.

Schematic representation of the two different partitions for which buffered-force calculates the forces each time step. QM molecules are depicted as ball and stick and MM molecules as thick lines. Background colors are used to indicate the different regions: orange (A-region), yellow (T-region), and white (environment).
