Figure 7.

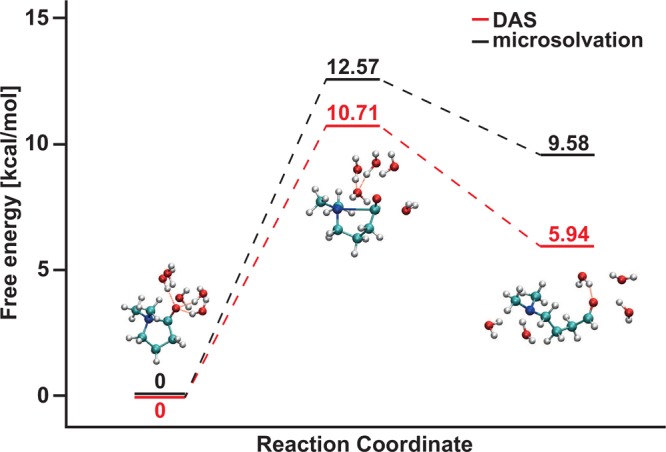
Schematic representation of the free energy profile of the N|···C+–O– bond breaking reaction. Typical snapshots of a DAS simulation are shown for the closed, transition, and open state of the NCO molecule.

Schematic representation of the free energy profile of the N|···C+–O– bond breaking reaction. Typical snapshots of a DAS simulation are shown for the closed, transition, and open state of the NCO molecule.