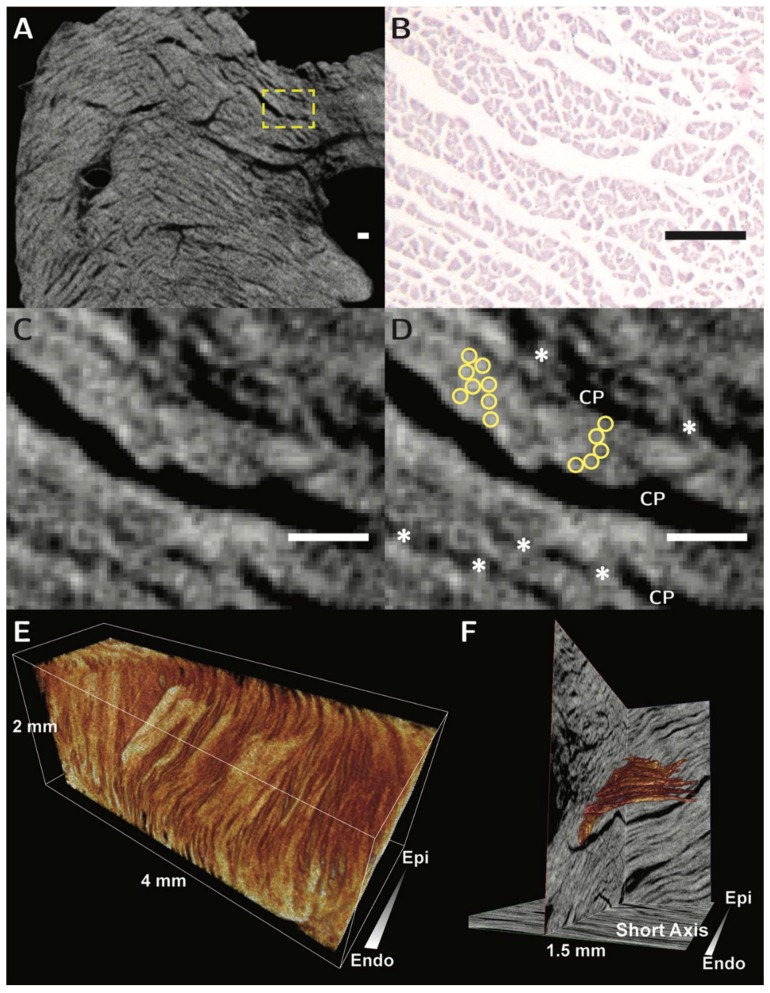
Figure 7.
The figure shows the virtual histology of the aggregated units of cardiomyocytes as revealed using micro-computed tomography. Panel (A) shows a long axis transmural image obtained from the basal region of the posterior wall of the left ventricle. The arrangement of the cardiomyocytes in the yellow dashed box is then shown in panel (B), which is an histological section stained with hematoxylin and eosin, and panels (C,D), which are micro-CT images. It is possible, in panel (D), to recognize the individual cardiomyocytes, shown in the yellow circles, the branches between adjacent aggregated units, shown by the asterisks, and the cleavage planes (CP) between the units. The scale bars in panels B, C and D represent 100 µm. Panel (E) shows volume rendering of a subendocardial block of rabbit ventricular wall, showing the three-dimensional morphology of multiple aggregates. In Panel (F), a solitary aggregated unit of cardiomyocytes, shown in orange, has been reconstructed subsequent to resolution of the contained individual chains of cardiomyocytes. The illustrations are modified from Stephenson et al., 2016 [18]. Our work is now continuing so as to characterize the morphology of the cardiac mesh in different contractile states. Micro-computed tomography, therefore, now offers the means of providing three-dimensional validation of the exciting results already achieved in patients using diffusion tensor magnetic resonance imaging. When these studies are completed, we hope to be able to provide the much-needed accurate anatomical model of the three-dimensional mesh.

