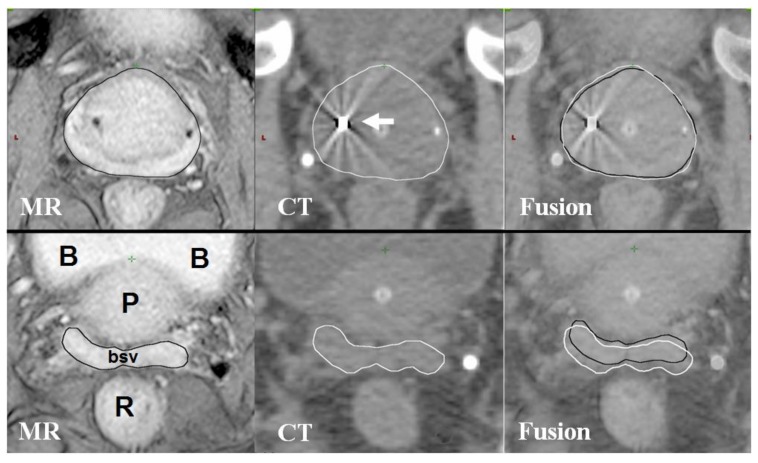
Figure 2.
MR and CT fusion for prostate contouring.Axial MR and CT images at the level of the prostate (upper three images) and base of seminal vesicles (lower three images). B, bladder; P, prostate; bsv, base of seminal vesicles; R, rectum. White arrow shows gold fiducial marker on CT image. MRI-based contours are in black, CT-based contours are in white. The upper three images demonstrate good fusion of prostate MRI and CT imaging; lower three images from the same patient showing less accurate fusion at the base of seminal vesicles. The difference in position of bsv can be seen in the fusion images where contours from MRI (black) and CT (white) are shown overlapping.

