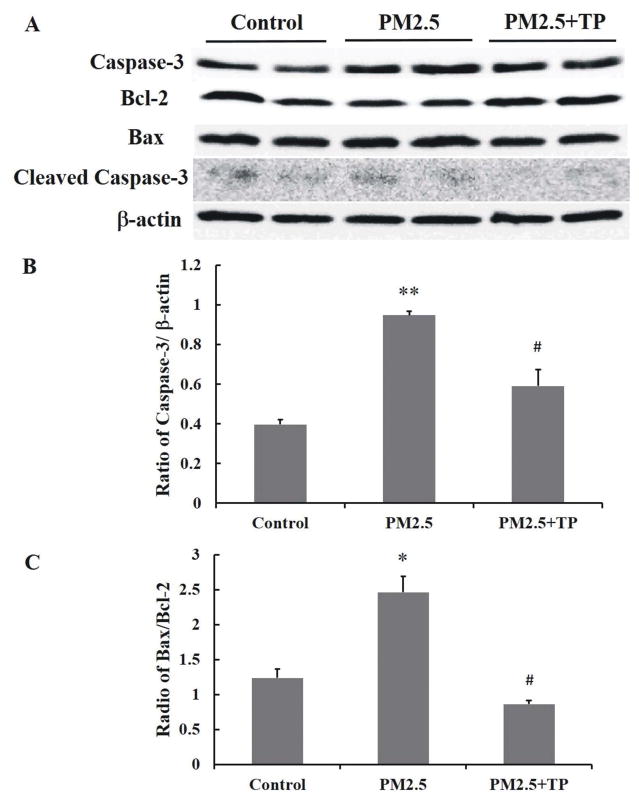
Fig. 7. Tea polyphenol treatment attenuates PM2.5 treatment-induced increase in cleaved Caspase-3 levels in A549 cells.
(A) Western blot analysis of total cell lysate was performed on A549 cells exposed to 50 μg/mL PM2.5 for 24 hours and then treated with 10 μg/mL tea polyphenols (TP) for an additional 24 hours. β-actin was used as a loading reference to normalize across samples and treatment conditions. The density of the caspase-3, bcl-2, bax, and β-actin protein bands was quantified using Image Pro Plus software and the data graphed as the mean ratio ± S.E of cleaved caspase-3 relative to β-actin (B) and bax relative to bcl-2 (C) from three independent experiments with a total n = 3. Asterisks indicate statistically significant differences between exposed and control cells, (*) P< 0.05, (**) P< 0.01, and between exposed cells in PM2.5 and treated cells in tea polyphenols (#) P< 0.05.

