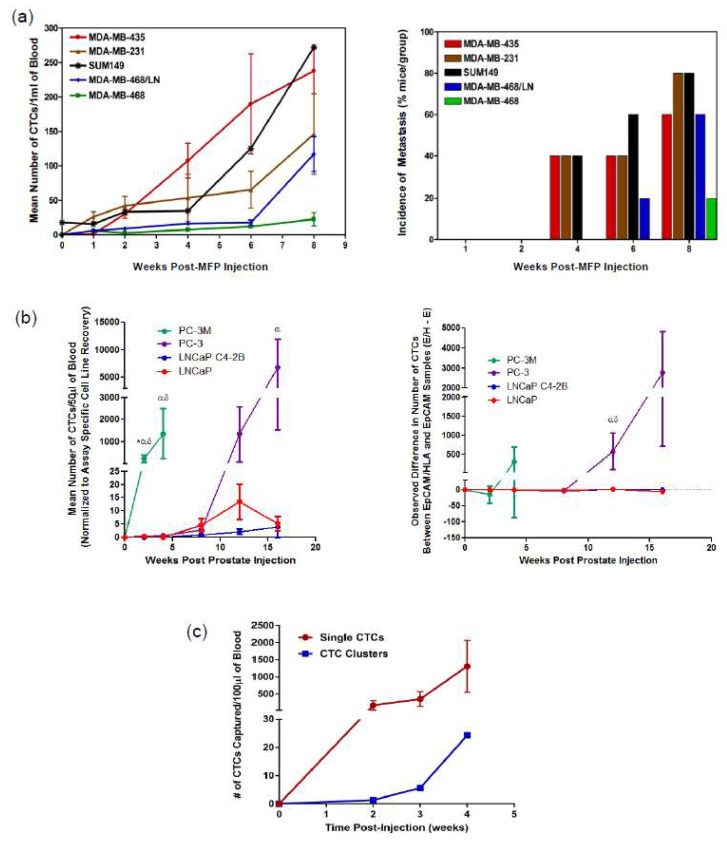
Figure 3.
Technologies for CTC analysis and metastasis tracking in animal models of cancer. (a) Human breast cancer cell lines of differing metastatic abilities were injected into female nude (nu/nu) mice or NOD/SCID mice via the mammary fat pad (MFP). At several time points post-injection, mice were sacrificed and blood (1 mL) and tissues were collected and analyzed. CTC kinetics in blood was measured by flow cytometry (left panel; mean ± SEM, n = 5 mice/group) and the incidence of lung metastasis (% of mice in the group) was measured as assessed histopathology (right panel). Adapted from Reference [72]. (b) Human prostate cancer cells of differing metastatic ability were injected into male nude mice via the right dorsolateral lobe of the prostate gland. At several timepoints post injection, mice were sacrificed and blood (100 µL) was collected and split into two 50 µL aliquots before analysis using an adapted CellSearch® CTC assay to assess CTC kinetics between epithelial (LNCaP, C4-2B) versus mesenchymal (PC-3M, PC-3) cell lines (left panel, mean ± SEM, n = 5–12 mice/group). To compare the difference in CTC number detected using EMT-dependent (EpCAM+) versus EMT semi-independent (EpCAM+/HLA+) adapted CellSearch® assays in matched samples (right panel; mean ± SEM); positive values = more CTCs detected with EMT semi-independent assay, negative values = more CTCs detected with EMT-dependent assay. * = significant difference relative to PC-3; α = significant difference relative to LNCaP C4-2B; δ = significant difference relative to LNCaP (p ≤ 0.05). Adapted from Reference [45]. (c) Human PC-3 prostate cancer cells (mesenchymal phenotype) were injected into male nude mice via the right dorsolateral lobe of the prostate gland. At several timepoints, post injection blood (100 µL) was serially collected and analyzed using the Parsortix™ CTC analysis platform.

