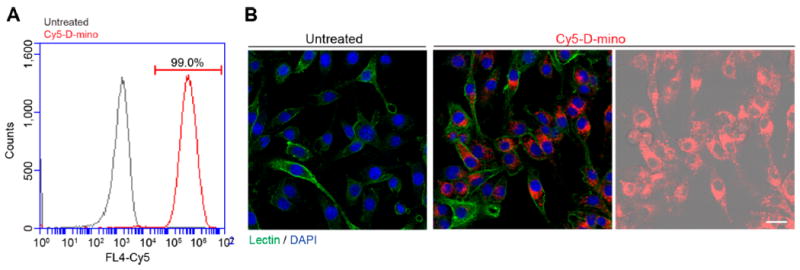
Figure 5.

Cellular uptake of Cy5−D-mino. Preactivated BV-2 microglia by LPS at 100 ng/mL for 3 h were treated with Cy5−D-mino (2.5 μM) for 3 h. (A) Flow cytometry after treatment. Cy5 intensity on x-axis is plotted against the cell counts on y-axis. (B) Confocal microscopy of Cy5−D-mino (red) cell uptake into BV-2 microglia. The cells were stained with Isolectin-488 (green). In the right panel, Cy5 signal is overlaid on DIC image of cells. Scale bar: 25 μm.
