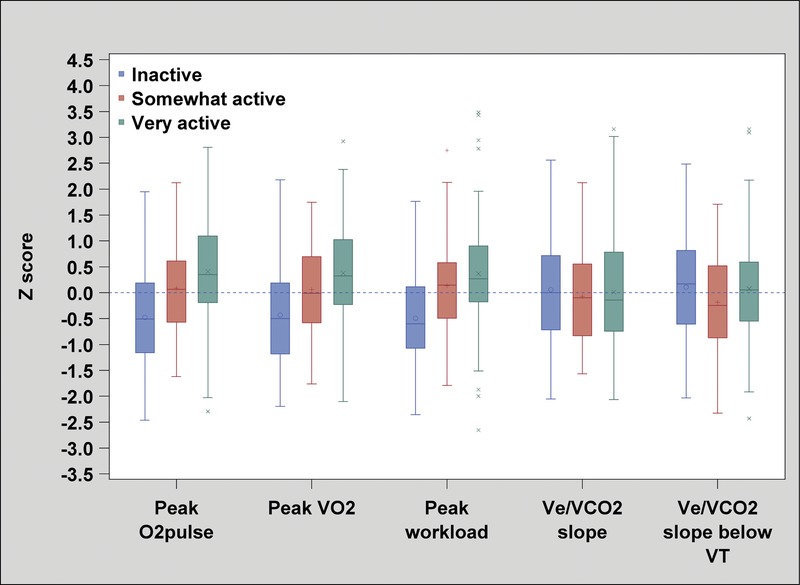
FIGURE 2.

Mean Z score of maximal and submaximal CRF parameters stratified according to level of habitual physical activity. We found significant differences (P < 0.0001) between the Z score of maximal CRF parameters (peak O2pulse, peak V˙O2, and peak workload) and the level of habitual physical activity. We found no significant differences between the Z score of submaximal CRF parameters (V˙O2/workload, V˙e/V˙CO2 slope, and V˙e/V˙CO2 slope below VT) and the level of habitual physical activity (P = 0.13, P = 0.89, and P = 0.16, respectively).
