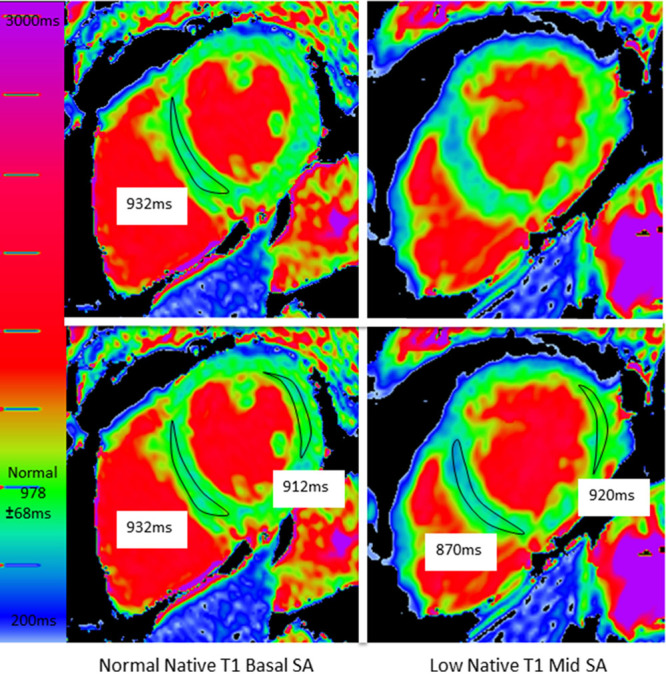
Figure 1.

A patient with obvious but missed low native T1. Top: The usual approach is to draw one region of interest (ROI) in a single short-axis (SA) slice. This generated a normal native T1 (932 ms). Note, however, there is blue myocardium in the second, unmeasured slice. By drawing other ROIs on both slices (bottom), the low native T1 is captured.
