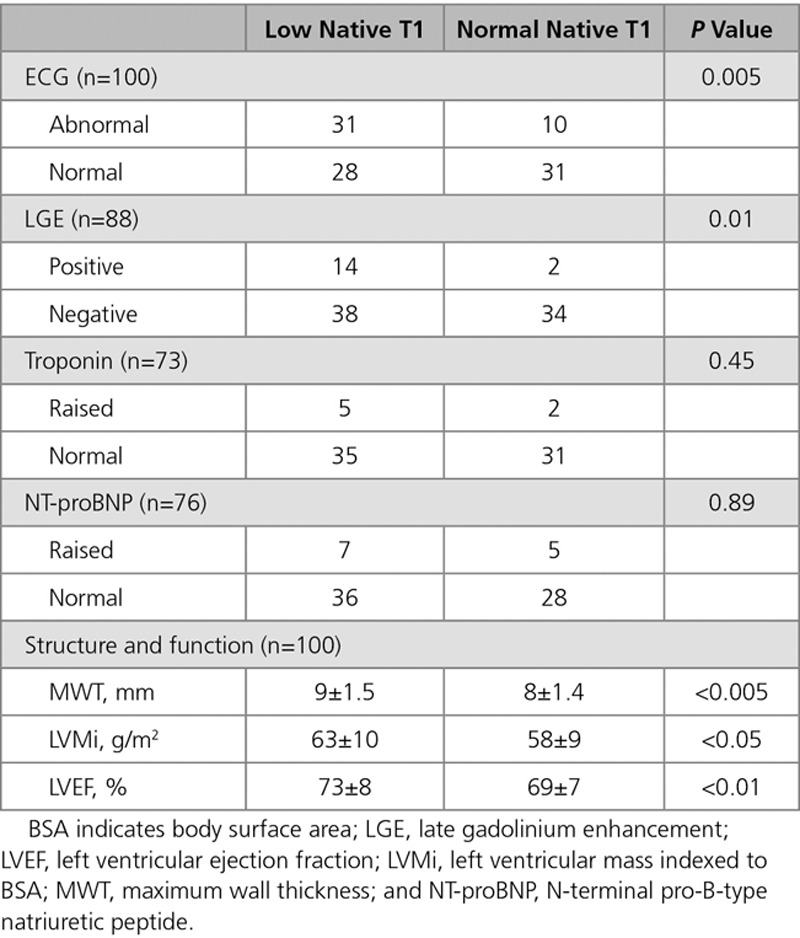
Table 3.
Comparison Between Low Native T1 and Normal Native T1 Fabry Disease With ECG, LGE, Troponin, NT-proBNP, MWT, LVMi, and LVEF

Comparison Between Low Native T1 and Normal Native T1 Fabry Disease With ECG, LGE, Troponin, NT-proBNP, MWT, LVMi, and LVEF
