
Fig. 5.
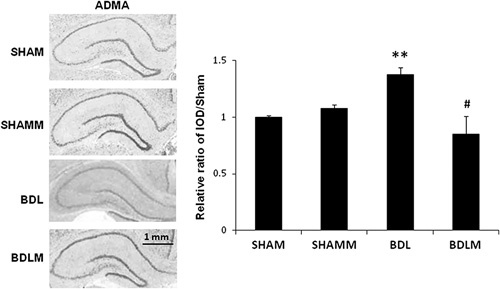
Immunohistochemical staining of ADMA in rat brain. The ADMA level was decreased in the BDL rats. However, melatonin treatment prevented the decrease in ADMA levels (the BDLM group). The IOD in the positive areas of the rat cortex was measured using Image-Pro Plus 6.0 software. The IOD/area values of ADMA expression are shown in the histogram. **P<0.001 versus the SHAM group; #P<0.05 versus the BDL group. N=3 in each group. Scale bar=100 µm. ADMA, asymmetric dimethylarginine; BDL, bile duct ligation; BDLM, bile duct ligation treated with melatonin; IOD, integrated optical density; SHAM, sham control; SHAMM, sham control treated with melatonin.