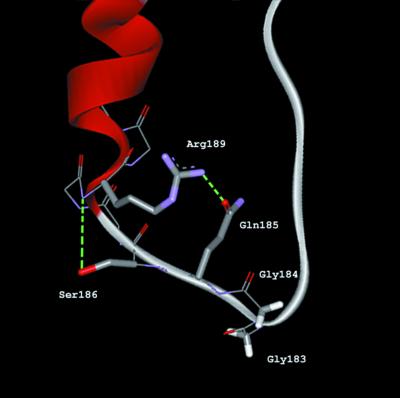
Figure 3.
Ribbon diagram of the minidomain containing the GGQ tripeptide derived from crystallographic data (12) by WebLab ViewerLite program version 4.0 (Molecular Simulations Inc.). Side-chain residues of Gly183, Gly184, Gln185, Ser186 and Arg189 displayed in a stick mode and backbone in a line mode. Hydrogen bonds are coloured in green.

