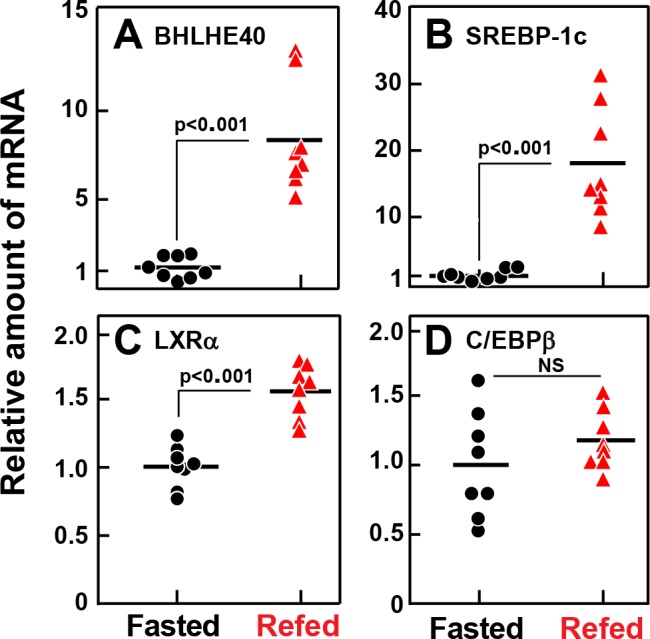
Figure 2. Relative amounts of mRNA for BHLHE40 (A), SREBP-1c (B), LXRα (C), and C/EBPβ (D), in livers of rats subjected to fasting and refeeding.

Male rats (age 2–3 months) were either fasted for 48 hr, or fasted for 48 hr and then refed with a high-carbohydrate diet for 6 hr. Total liver RNA from eight rats in each group was subjected to quantitative RT-PCR. Each black circle (fasted rats) or red triangle (refed rats) represents an individual animal. Each value in the refed group represents the amount of mRNA relative to the mean amount in the fasted group, which is arbitrarily defined as 1.0. Mean Ct values for BHLHE40, SREBP-1c, LXRα, and C/EBPβ in the fasted groups were 24.9, 23.9, 24.9, and 24.4, respectively. NS, not significant. p-Values calculated using Student’s t-test.
