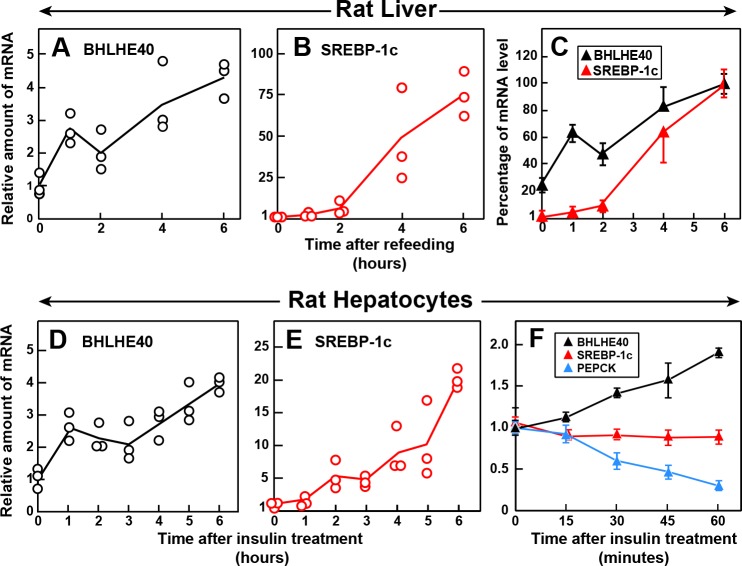
Figure 7. Time course of induction of BHLHE40 and SREBP-1c mRNA in livers of refed rats (A–C) and in primary rat hepatocytes treated with insulin (D–F).
(A–C) Male rats (age, 2–3 months) were fasted for 48 hr and then refed with a high-carbohydrate diet for the indicated time, after which total RNA from the liver was subjected to quantitative RT-PCR. Each point in (A) and (B) represents the mRNA level from a single animal relative to the mean value from three fasted rats (i.e. zero-time values). Zero-time Ct values for BHLHE40 and SREBP-1c were 23.5 and 25.7, respectively. Values in (C) represent the mean ± SEM of the values from (A) and (B) plotted as the percentages of the 6 hr value, which is defined as 100%. (D–F) Hepatocytes from nonfasted male rats (age, 2–3 months) on a chow diet were prepared and plated on day 0. On day 1, the cells received either no insulin or 100 nM insulin for the indicated time, after which the cells were harvested for measurement of total RNAs by quantitative RT-PCR. Each value in (D) and (E) (6 hr time course) represents the amount of mRNA from a single dish relative to that of the mean value from the three dishes at zero-time, which is defined as 1.0. Mean Ct values (zero-time) for BHLHE40 and SREBP-1c in the absence of insulin were 23.6 and 26.4, respectively. The values in (F) (1 hr time course) represent the mean ±SEM of the values from three dishes. Mean Ct values (zero-time) for BHLHE40, SREBP-1c, and PEPCK in the absence of insulin were 23.6, 26.3, and 20.0, respectively.

