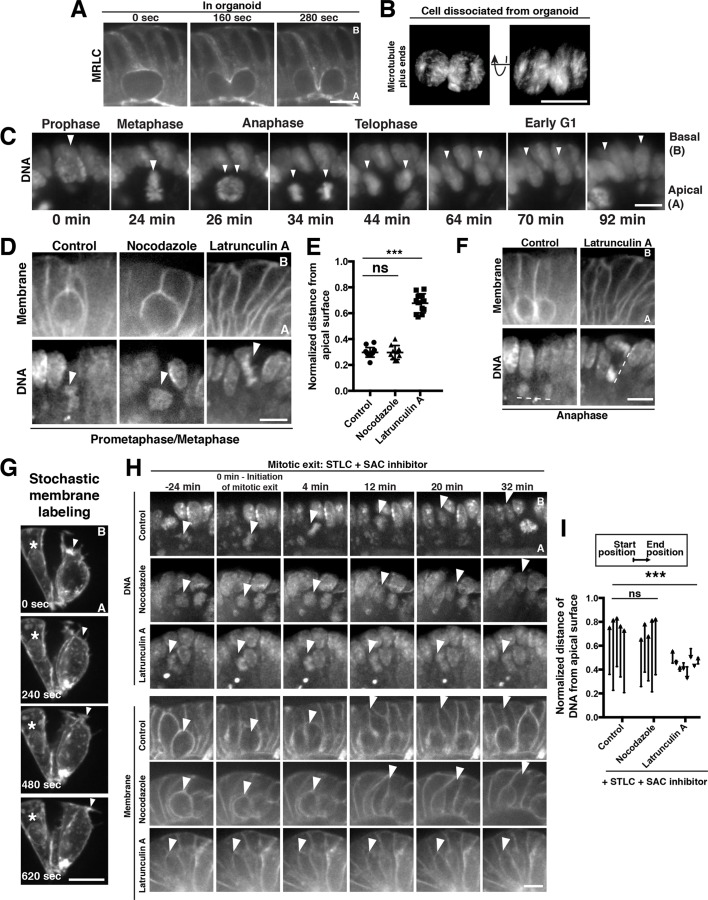
Figure 2. Polarized actin-dependent cell shape changes underlie division-coupled interspersion behaviors.
(A) Frames from time-lapse imaging of cytokinesis in an organoid expressing myosin regulatory light chain (MRLC)-mScarlet. (B) 3D reconstruction from live imaging of a cell dissociated from EB3-GFP organoids undergoing cytokinesis. EB3-GFP labeled organoids were used to facilitate identification of dissociated cells undergoing mitosis. Representative of 12/15 divisions. (C) Frames from SPIM of chromosome segregation in a live organoid. DNA: H2B-mScarlet. Arrowheads indicate mitotic chromosome masses. (D) Frames from confocal imaging of mitotic cells in live organoids treated with cytoskeletal inhibitors for 30 min before initiation of imaging. Membranes: R26mTmG; DNA: SiR-DNA. Arrowheads: mitotic chromosomes. (E) Quantification of the distance of mitotic chromosomes from the apical surface of the organoid epithelium following treatment with cytoskeletal inhibitors, normalized to the total apical-basal height of the epithelium, n ≥ 10. ns: not significant; ***p<0.001, Student’s t-test. (F) Anaphase of mitoses shown in (D). Dashed lines underline anaphase chromosome masses. (G) Frames from time-lapse imaging of Vil1CreERT2; R26mTmG organoids in which recombination has been induced at low levels to label a subset of cell membranes in the organoid. The protrusive front of one daughter cell is indicated by an arrowhead. Note that the division occurred along the imaging plane, such that the other daughter cell is ‘behind’ the imaged daughter cell. Asterisk: nearby interphase cell that did not participate in the division. (H) Frames from confocal imaging of live organoids testing the cytoskeletal requirements for the basal movement of nascent nuclei (top, arrowheads indicate chromosomes) and elongation of the basal cell edge (bottom, arrowhead indicates basal edge of reinserting cell). A schematic of this experiment is shown in Figure 2—figure supplement 1I. DNA: SiR-DNA; Membrane: R26mTmG; STLC: Eg5 inhibitor to induce mitotic arrest; SAC: spindle assembly checkpoint. (I) Quantification of DNA position before SAC inhibition (starting position), and at chromosome decondensation (end position), normalized to the total apical-basal distance of the epithelium. Arrowheads point towards the end position after mitotic exit. n ≥ 5, ns: not significant, ***: p<0.001, Student’s t-test of comparing end position and start position. Scale bars, 10 µm.


