. 2018 Jun 18;7:e36144. doi: 10.7554/eLife.36144

Figure 4. Some TALE-occupied sites are associated with chromatin marks at blastula stages and developmental control genes are enriched near MPADs displaying repressive histone modifications.

See also Figure 4—figure supplements 1 and 2. (A) Heatmaps displaying chromatin features at genomic regions occupied by Prep at 3.5hpf. H3K4me1 signals at Prep-occupied elements was analyzed by K-mean (k = 4) clustering (left panel). H3K4me3, H3K27ac, H3K27me3, nucleosome, RNA-pol2 subunit RPB1 and Methyl CpG signals are displayed based on the H3K4me1 clustering order. (B) Average nucleosome signal at MPADs and non-MPADs (as defined in A). (C) Distribution of MPADs and non-MPADs relative to TSSs. (D) GO term enrichment for MPADs and non-MPADs identified by GREAT (nearest gene within 30 kb). Note that genes associated with Class 3 MPADs or non-MPADS are not enriched for GO terms. Only select categories are presented, a full list of GO terms is available in Supplementary file 2. FDR = Binomial False Discovery Rate. (E) Conservation of 3.5hpf Prep-occupied sites among vertebrates generated using PhastCons vertebrate 8-way comparison. The score shown is the probability (0 ≤ p ≤ 1) that each nucleotide belongs to a conserved genomic element. (F) Heatmaps displaying chromatin features at MPADs. H3K27ac and H3K27me3 signals at MPADs were analyzed by K-mean (k = 4) clustering. H3K4me1, H3K4me3, nucleosome and RBP1 signals are displayed based on the H3K27ac/me3 clustering order. (G) Box plots showing average expression of genes near (≤30 kb) each of the four MPAD classes, as determined by RNA-seq on 6hpf embryos. Data are presented as log2 of mean TPM (transcripts per million) values from three biological replicates. Statistical test: pairwise comparison with Kruskal-Wallis followed by Dunn's post-hoc test.

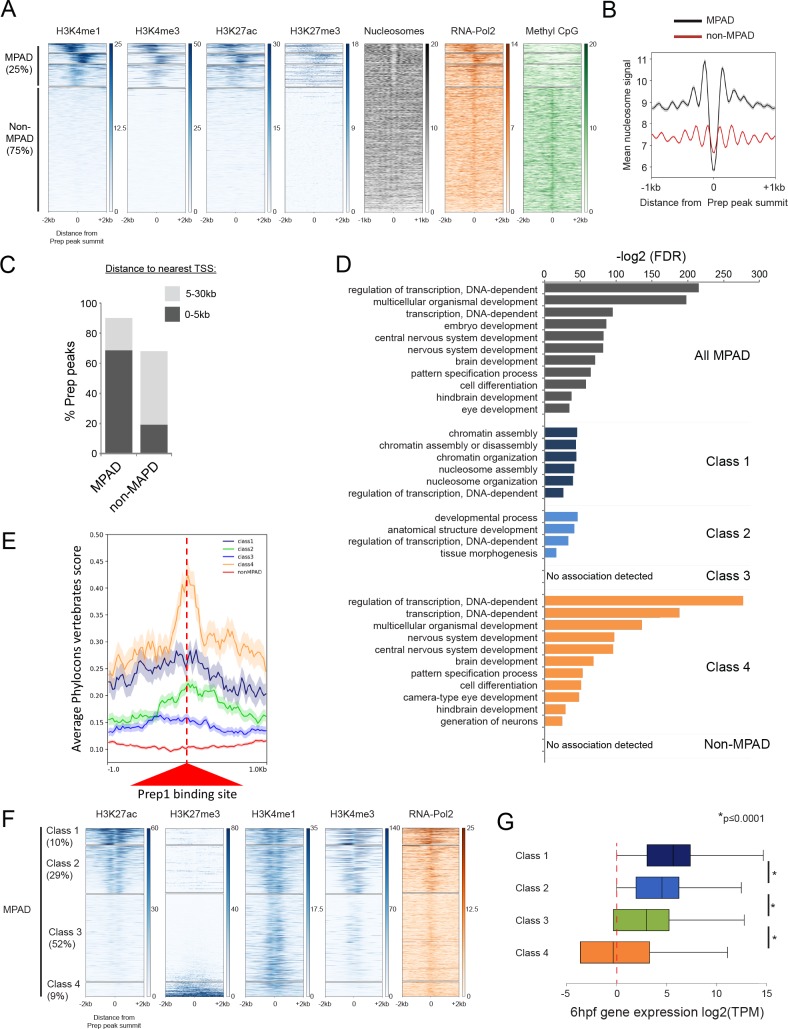
Figure 4.

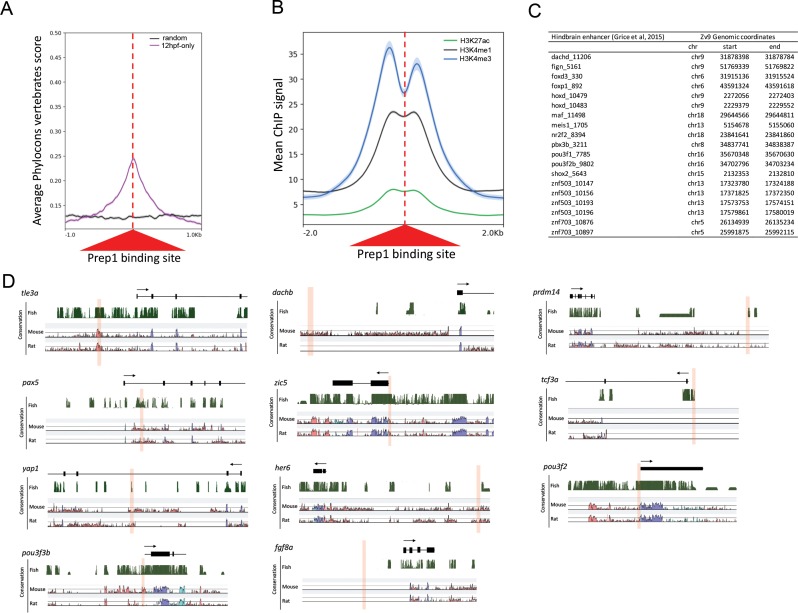
Figure 4—figure supplement 1. Comparison of early and late Prep-occupied sites.

Figure 4—figure supplement 1.

(A) Conservation of Prep12hpf-only-occupied sites among vertebrates plotted using PhastCons vertebrate 8-way comparison. The score shown is the probability (0 ≤ p ≤ 1) that each nucleotide belongs to a conserved genomic element. (B) Average ChIP-seq signal for H3K27ac, H3K4me1 and H3K4me3 at Prep12hpf-only-occupied sites. (C) Table listing hindbrain enhancers (identified in [Grice et al., 2015]) that overlap with a Prep12hpf-only-occupied site by 50 bp. (D) Assessment of sequence conservation for eleven Prep3.5hpf-occupied sites. Browser shots of conservation among fish (displayed as PhastCons plots in the UCSC browser), mouse and rat (displayed in VISTA plots) were aligned based on the exon/intron structure of the nearest gene.
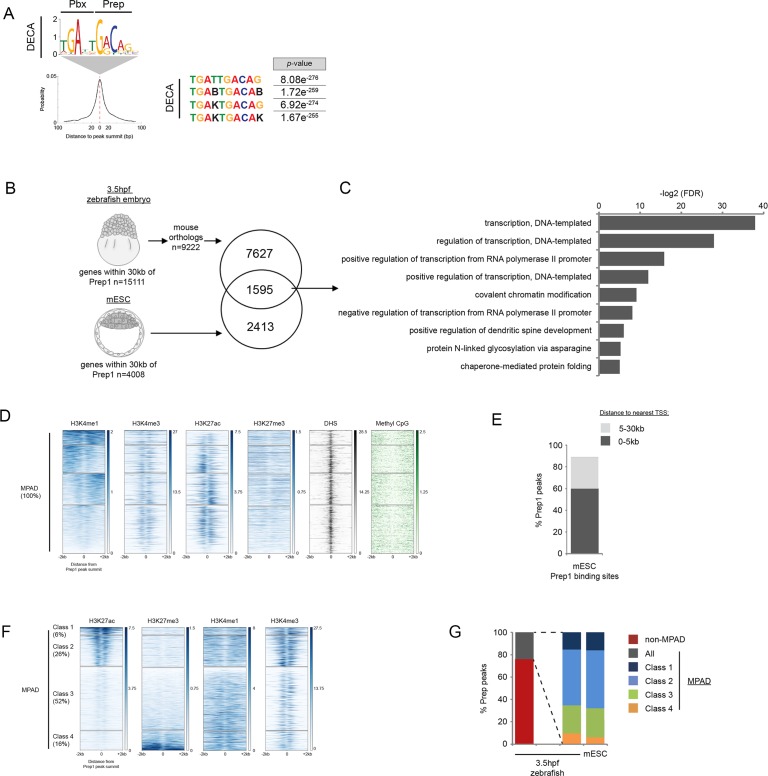
Figure 4—figure supplement 2. TALE occupancy in mESCs is associated with chromatin profiles similar to 3.5hpf zebrafish embryos.

Figure 4—figure supplement 2.

(A) Sequence logo, enrichment and localization relative to Prep1 peak summit of the DECA motif in mESCs (using data from [Laurent et al., 2015]). p-values for enrichment above random occurrence were calculated using the ranksum test in AME. Motifs are shown in IUPAC code (B = C, G or T; K = T or G). (B) Identification of genes bound by Prep in 3.5hpf zebrafish embryos and mESC. 1595 genes are associated with (within 30 kb) Prep binding in 3.5hpf zebrafish embryos and mESCs. (C) DAVID analysis of the 1,595 Prep-associated genes common to 3.5hpf embryos and mESCs identified in Figure 4—figure supplement 2B. Note that only select categories are presented and that a full list of GO terms is available in Supplementary file 3. FDR = Benjamini multiple testing False Discovery Rate. (D) Heatmaps displaying chromatin features at genomic regions occupied by Prep1 in mESCs. H3K4me1 signal at Prep-occupied elements was analyzed by K-mean (k = 4) clustering (left panel). H3K4me3, H3K27ac, H3K27me3, DNAse Hypersensitivity Sites (DHS), and methyl CpG signals are displayed based on the H3K4me1 clustering order. (E) Distribution of mESC MPADs relative to TSSs. (F) Heatmaps displaying chromatin features at mESC MPADs. H3K27ac and H3K27me3 signals at MPADs were analyzed by K-mean (k = 4) clustering. H3K4me1, H3K4me3 signals are displayed based on the H3K27ac/me3 clustering order. (G) Graph showing the percent of Prep binding in each category (MPAD, non-MPAD and MPAD classes) in 3.5hpf zebrafish embryos and mESCs.