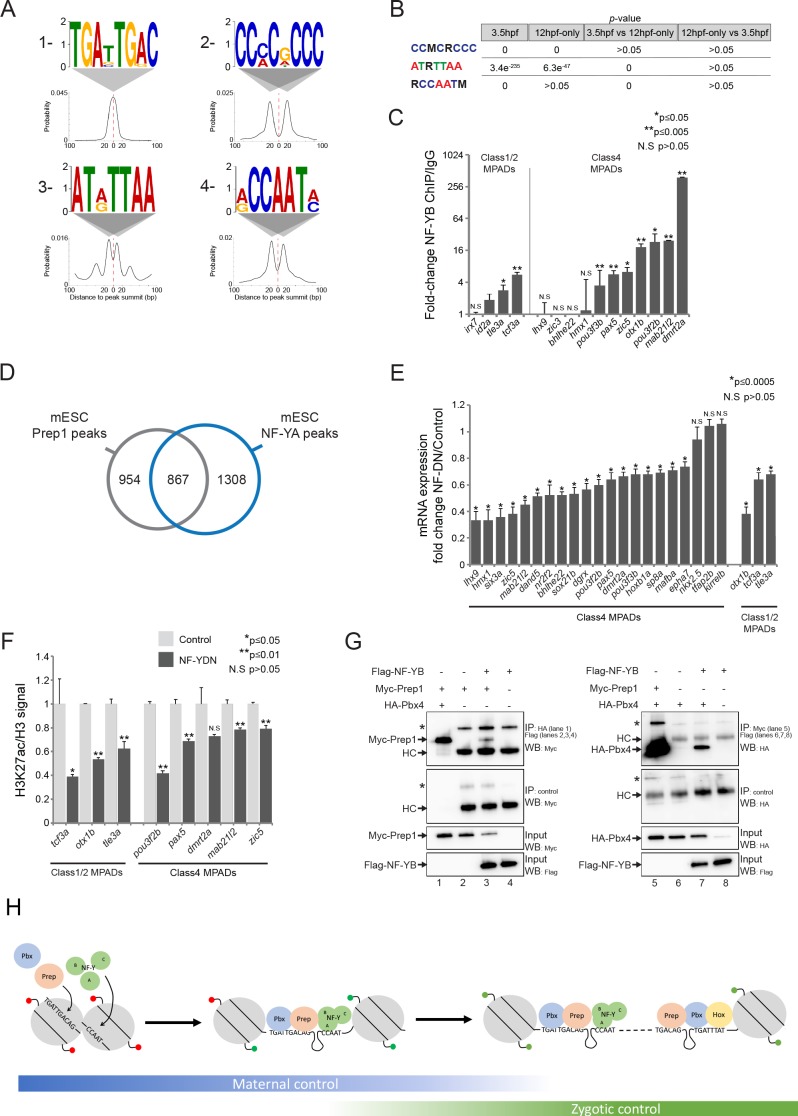
Figure 7. NF-Y proteins regulate TALE GRN expression and form complexes with TALE factors.
See also Figure 7—figure supplement 1. (A) Sequence logo and localization relative to Prep peak summits of motifs identified by DREME at Prep3.5hpf peaks. (B) Enrichment of motifs in Prep3.5hpf and Prep12hpf-only peaks as defined by AME. p-values for enrichment above random occurrence (3.5hpf and 12hpf-only columns) or between two Prep peak populations (3.5hpf vs 12hpf-only and 12hpf-only vs 3.5hpf columns) were calculated using the ranksum test in AME. Motifs are represented in IUPAC code (M = A or C; R = A or G). (C) ChIP-qPCR showing NF-YB binding at CCAAT motif-containing MPADs in 9hpf embryos. MPADs are labeled with the name of the nearest gene. Data of three independent biological replicates are presented as mean fold change ± SEM of NF-YB IP vs control IgG. Statistical test: unpaired t-test. (D) Venn diagram illustrating the overlap of Prep and NF-YB peaks in mESCs. Two peaks are considered to overlap if their summits are within 500 bp. (E) RT-qPCR analysis of gene expression in 12hpf NF-YDN injected embryos. Results are shown as gene expression fold-change in NF-YDN vs control for select TALE-dependent genes. Data of three independent experiments are presented as mean fold change ± SEM of NF-YDN injected vs control embryos. Statistical test = unpaired t-test. (F) H3K27ac/Histone H3 signal ratio at MPADs (labeled with the name of the nearest gene) as determined by ChIP-qPCR in 9hpf control vs NF-YDN injected embryos. Data of three independent biological replicates are presented as mean fold change ± SEM of NF-YDN vs control. Statistical test: unpaired t-test. (G) Co-IP experiments showing interaction of Myc-Prep (left panels) and HA-Pbx4 (right panels) with Flag-NF-YB in transfected HEK293 cells. HC = Ig heavy chain. Asterisks indicate non-specific signal. (H) Model diagram. At blastula stages (left side) TALE binds DECA motifs (TGATTGACAG) near NF-Y motifs (CCAAT). At this stage, most binding sites are occupied by nucleosomes and those associated with developmental control genes are marked by H3K27me3 (red lollipops). Binding of TALE and NF-Y leads to deposition of H3K27ac (green lollipops) and improved accessibility. At segmentation stages (right side), TALE continues to bind DECA motifs near NF-Y motifs, but Prep also binds HEXA motifs (TGACAG) near PBX:HOX motifs (TGATTTAT). Most of the HEXA motifs lack nucleosomes and are found within 40 kb of a DECA/NF-Y site (indicated by dashed connecting line). At this stage, developmental control genes are marked by H3K27ac and are expressed.


