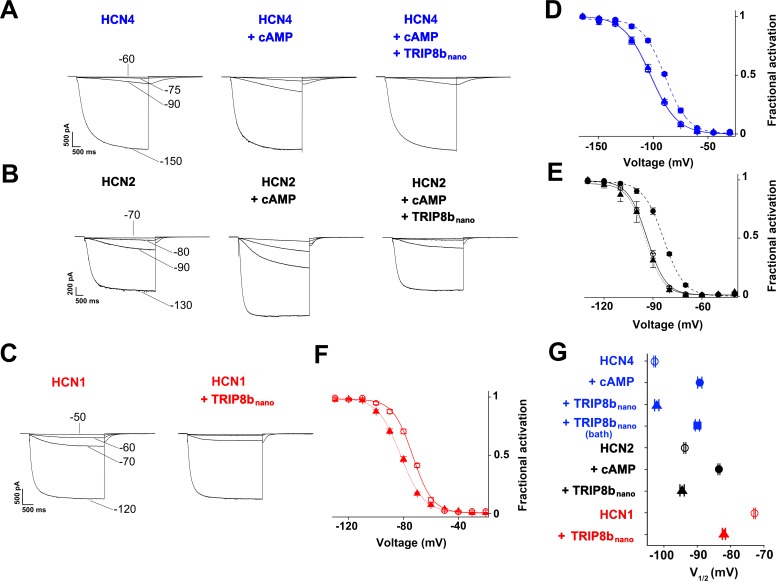
Figure 4. TRIP8bnano abolishes cAMP effect on HCN channel gating.
(A-C) Representative whole-cell HCN4, HCN2 and HCN1 currents recorded, at the indicated voltages, with control solution or with cAMP (1 μM for HCN4 and 5 μM for HCN2) or with cAMP + 10 µM TRIP8bnano in the patch pipette (for HCN1, 10 µM TRIP8bnano only was added). (D-F) Mean activation curves measured from HCN4, HCN2 and HCN1 in control solution (open circles), cAMP (filled circles), cAMP +TRIP8bnano, or TRIP8bnano only in the case of HCN1 (filled triangles). Solid and dashed lines indicate Boltzmann fitting to the data (see Materials and methods). (G) Half activation potential (V1/2) values of HCN4 (blue), HCN2 (black) HCN1 (red) in control solution (open circle), cAMP (filled circle) and cAMP +TRIP8bnano, or TRIP8bnano only in the case of HCN1 (filled triangle). HCN4, control = −102.8 ± 0.3 mV; HCN4 +1 µM cAMP = −89.2 ± 0.6 mV; HCN4 +1 µM cAMP +10 µM TRIP8bnano = −102.1 ± 0.6 mV, HCN4 +1 µM cAMP in the patch pipette +10 µM TRIP8bnano in the bath solution = −91.7 ± 0.3 mV; HCN2, control = −93.7 ± 0.3 mV; HCN2 +5 µM cAMP = −83.5 ± 0.3 mV; HCN2 +5 µM cAMP +10 µM TRIP8bnano = −94.5 ± 0.6 mV; HCN1, control = −72.8 ± 0.2 mV; HCN1 +10 µM TRIP8bnano = −82 ± 0.5 mV. Data are presented as mean ± SEM. Number of cells (N) ≥ 11. There is no significant difference between the controls and the addition of TRIP8bnano with (HCN4, HCN2) or without (HCN1) cAMP in the pipette. No significant difference was observed following the addition of TRIP8bnano in the bath. Statistical analysis performed with two-way ANOVA, followed by post-hoc Tukey test (p<0.001).


