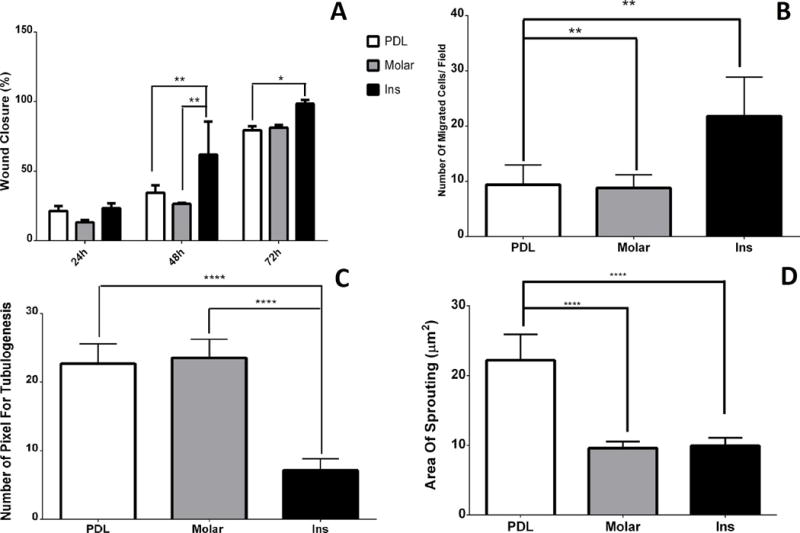
Figure 3.

A) The box plots of the means and standard deviations of the percentage of wound closure assay of experimental groups during 24, 48, and 72 hours culture. (*): Significant difference was detected between values of incisor group with PDL group after 72 hours; (**): Significant differences were detected between values of incisor group with PDL and molar groups after 48 hours. B) The box plots of the means and standard deviations of the number of migrating ECs per field of experimental groups. (**): Significant differences were noticed between values incisor group with PDL and molar groups. C) The box plots of the means and standard deviations of the number of pixel of tubulogenesis of experimental groups. (****): Significant differences were indicated between tubulogenesis values of PDL and molar groups with incisor group. D) The box plots of the means and standard deviations of the area of sprouting (μm2) of experimental groups. (****): Significant differences were indicated between area of sprouting values of incisor and molar groups with PDL group.
