Figure 3.

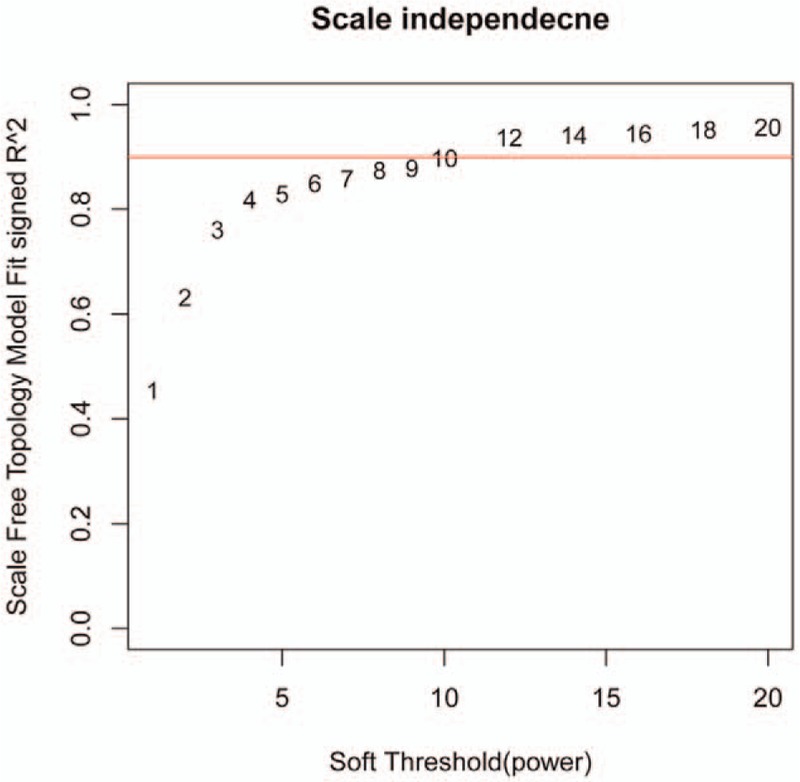
Calculation chart of adjacency matrix weighting parameters (power). The X-axis represents weighting parameters (power). The Y-axis represents quadratic of correlation index from log (k) and log (P(K)).

Calculation chart of adjacency matrix weighting parameters (power). The X-axis represents weighting parameters (power). The Y-axis represents quadratic of correlation index from log (k) and log (P(K)).