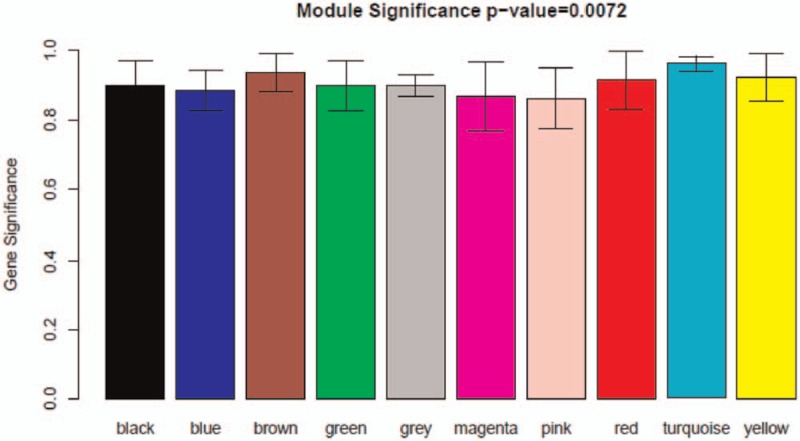
Figure 5.

Diagram of correlation of module's color and osteosarcoma. The relevance between eigenvalue of network modules and osteosarcoma-metastasis condition was qualified. The colored row indicates modules and the Y-axis represents gene significance.
