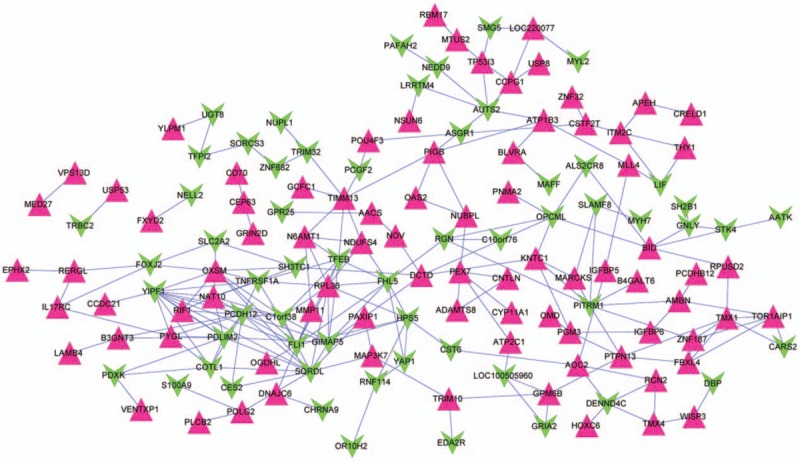
Figure 6.

Gene expression network derived from turquoise module. Equilateral triangle and inverted triangle represent downregulation and upregulation, respectively. The red point meant significantly upregulated expression genes while the green point meant down-regulated expression genes.
