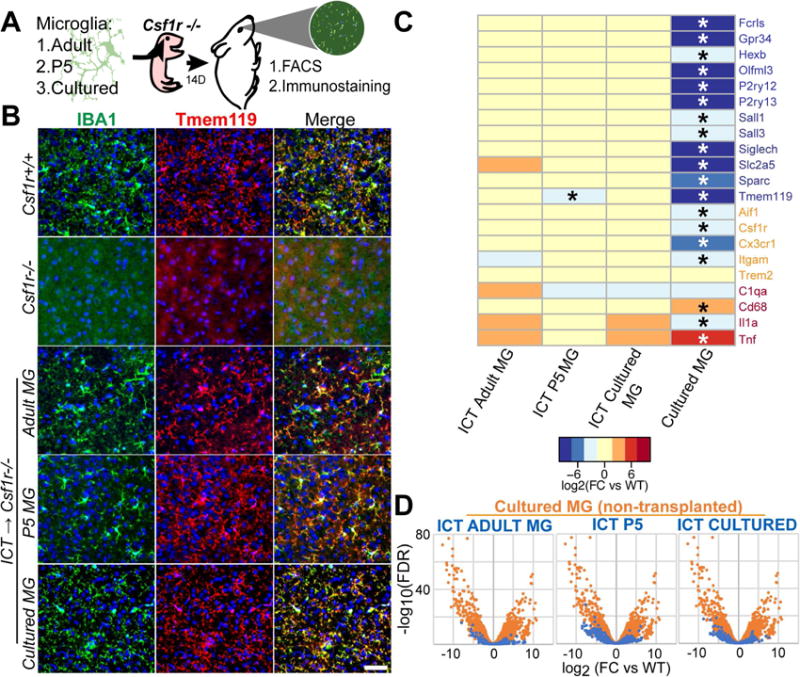
Figure 1. Transplanted microglia engraft in the Csf1r−/− brain and express Tmem119.

A) Schematic of microglial transplantation system. B) Immunostaining showing ramified IBA1+(green)/TMEM119+(red) microglia in Csf1r+/+ (WT) and microglia-transplanted Csf1r−/−hosts, and untransplanted Csf1r−/− control. Scale bar = 50μm. C) Expression heat map (log2(FC/WT)) of microglia (blue), myeloid (orange) and reactivity (red) genes by microglia after culture or transplantation into Csf1r−/− CNS. Detailed inventory of experimental replicates is listed in methods. * = FDR <0.05 compared with WT D) Overlaid volcano plots show reduced differential gene expression of ICT-cells (blue) compared to non-transplanted cultured MGs (orange), represented by reduced spread of volcano. See also Figure S1.
