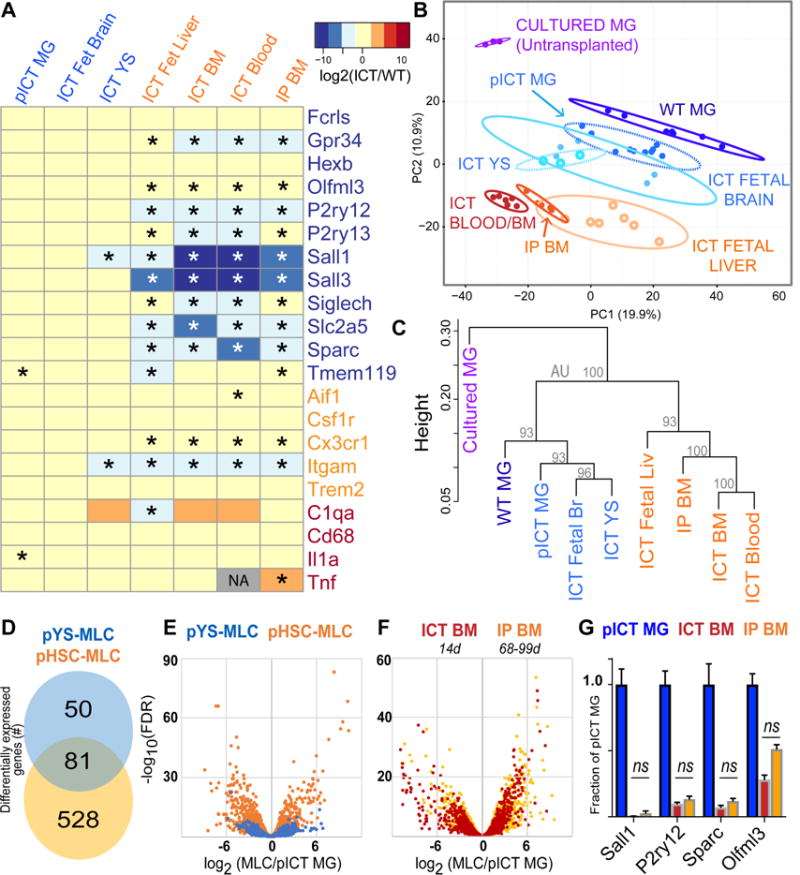
Figure 4. Ontogeny shapes adoption of microglial transcriptional identity; BM-derived cells show highly similar transcriptomes at 2 weeks compared to 2-3 months of brain residence.

A) Heatmap showing log2(FC versus WT) expression of microglial (blue), myeloid (orange) and reactivity (red) genes across MLC types. * = FDR<0.05 compared to WT. Grey box indicates that edgeR algorithm could not compute log2(FC) due to low read abundance. B) Plot of largest principal components for cultured microglia (purple), WT microglia (dark blue), pooled ICT MG (blue), YS-MLCs (ICT yolk sac, fetal brain; lighter shades of blue), fetal liver MLCs (light orange), and HSC-MLCs (ICT Blood, BM, and BMT; orange/red), using top 2500 most variant genes. Ellipses demarcate 95% confidence interval for assigned clusters. C) Unsupervised hierarchical clustering of microglia, pooled ICT microglia and MLCs by Spearman coefficients using 1000 most variant genes, AU = approximately unbiased p-value using PVclust package, bootstrap n=10000 D) Venn diagram showing differential gene expression between pooled YS- and HSC-MLCs, both compared to pooled ICT-MGs (2-fold cutoff, FPKM>20, FDR <0.05). See also Figure S5A. E) Volcano plot overlay showing differential gene expression of YS- and HSC-MLCs types compared to ICT-MGs, measured as log2(pMLC/pMG). F) Volcano plot overlay comparing MLCs derived from ICT BM at 14 days (red), to MLCs from IP BM at 2-3 months (orange) showing no gross shift in transcriptome difference from MGs. G) MG identity genes do not change between ICT BM (red) and IP BM (orange), ns, FDR >0.05 by edgeR comparison. See also Figure S5C. MG= microglia, MLC = microglia-like cell, ICT = intracerebral transplant, HSC = hematopoietic stem cells, YS = Yolk Sac, pYS= pooled YS, Fetal Br = fetal brain, Fetal Liv = fetal liver, IP BM = intraperitoneal bone marrow transplant. See also Figure S4, S5.
