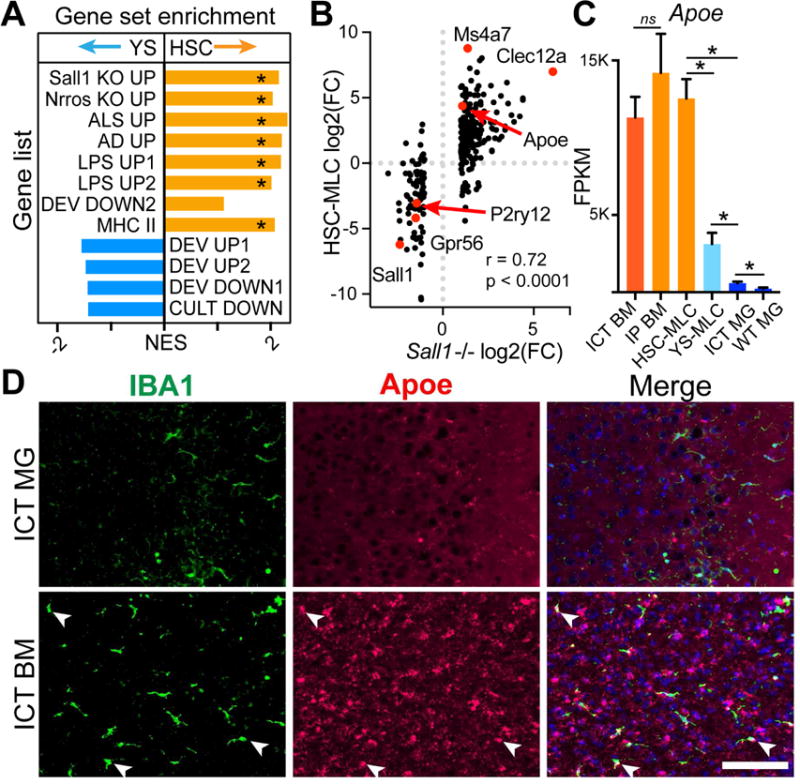
Figure 5. HSC-MLCs resemble microglia lacking identity genes and in disease states.

A) Normalized Enrichment Scores (NES) from GSEA comparing YS- to HSC-MLCs for enrichment in genes upregulated in Sall1−/− (Sall1 KO UP), Nrros−/− (Nrros KO UP), Amyotrophic Lateral Sclerosis (ALS UP from), AD (AD UP), after LPS treatment (LPS UP1, 2), changed in during development (DEV UP 1, 2 or DEV DOWN1,2), in culture (CULT DOWN) and MHCII genes. * = FDR <0.05. B) Expression plot comparing HSC-MLCs and Sall1−/− microglia, both expressed as log2(FC/WT). Red dots highlight genes of interest. r = correlation coefficient, p = p-value for linear regression analysis. C) Apoe gene expression in MGs/MLCs. * = FDR < 0.05. D) RNA in situ hybridization for Apoe (red) with IBA1 counterstain in Csf1r−/− brains 14D post-transplantation with BM or MGs. Arrows indicate Apoe+ MLCs. Scale bar = 100μm. See also Figure S5.
